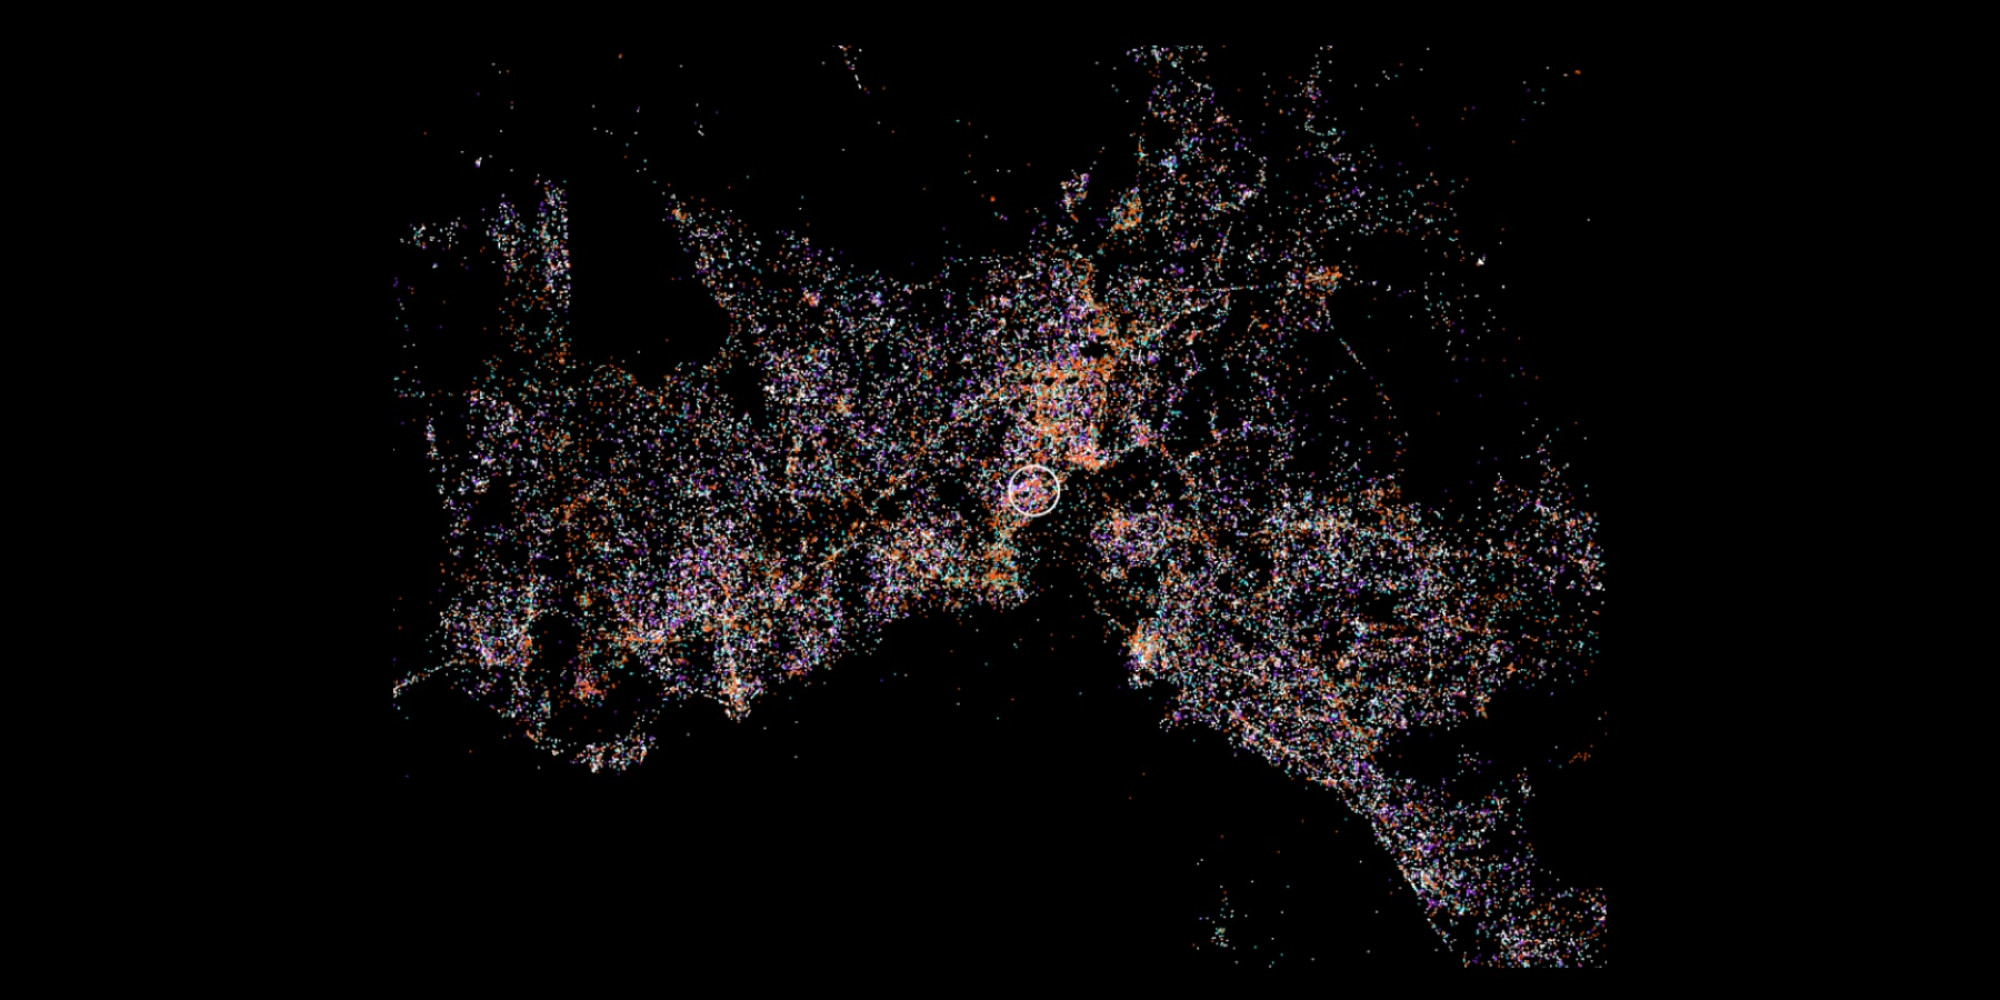
New Towns Traces
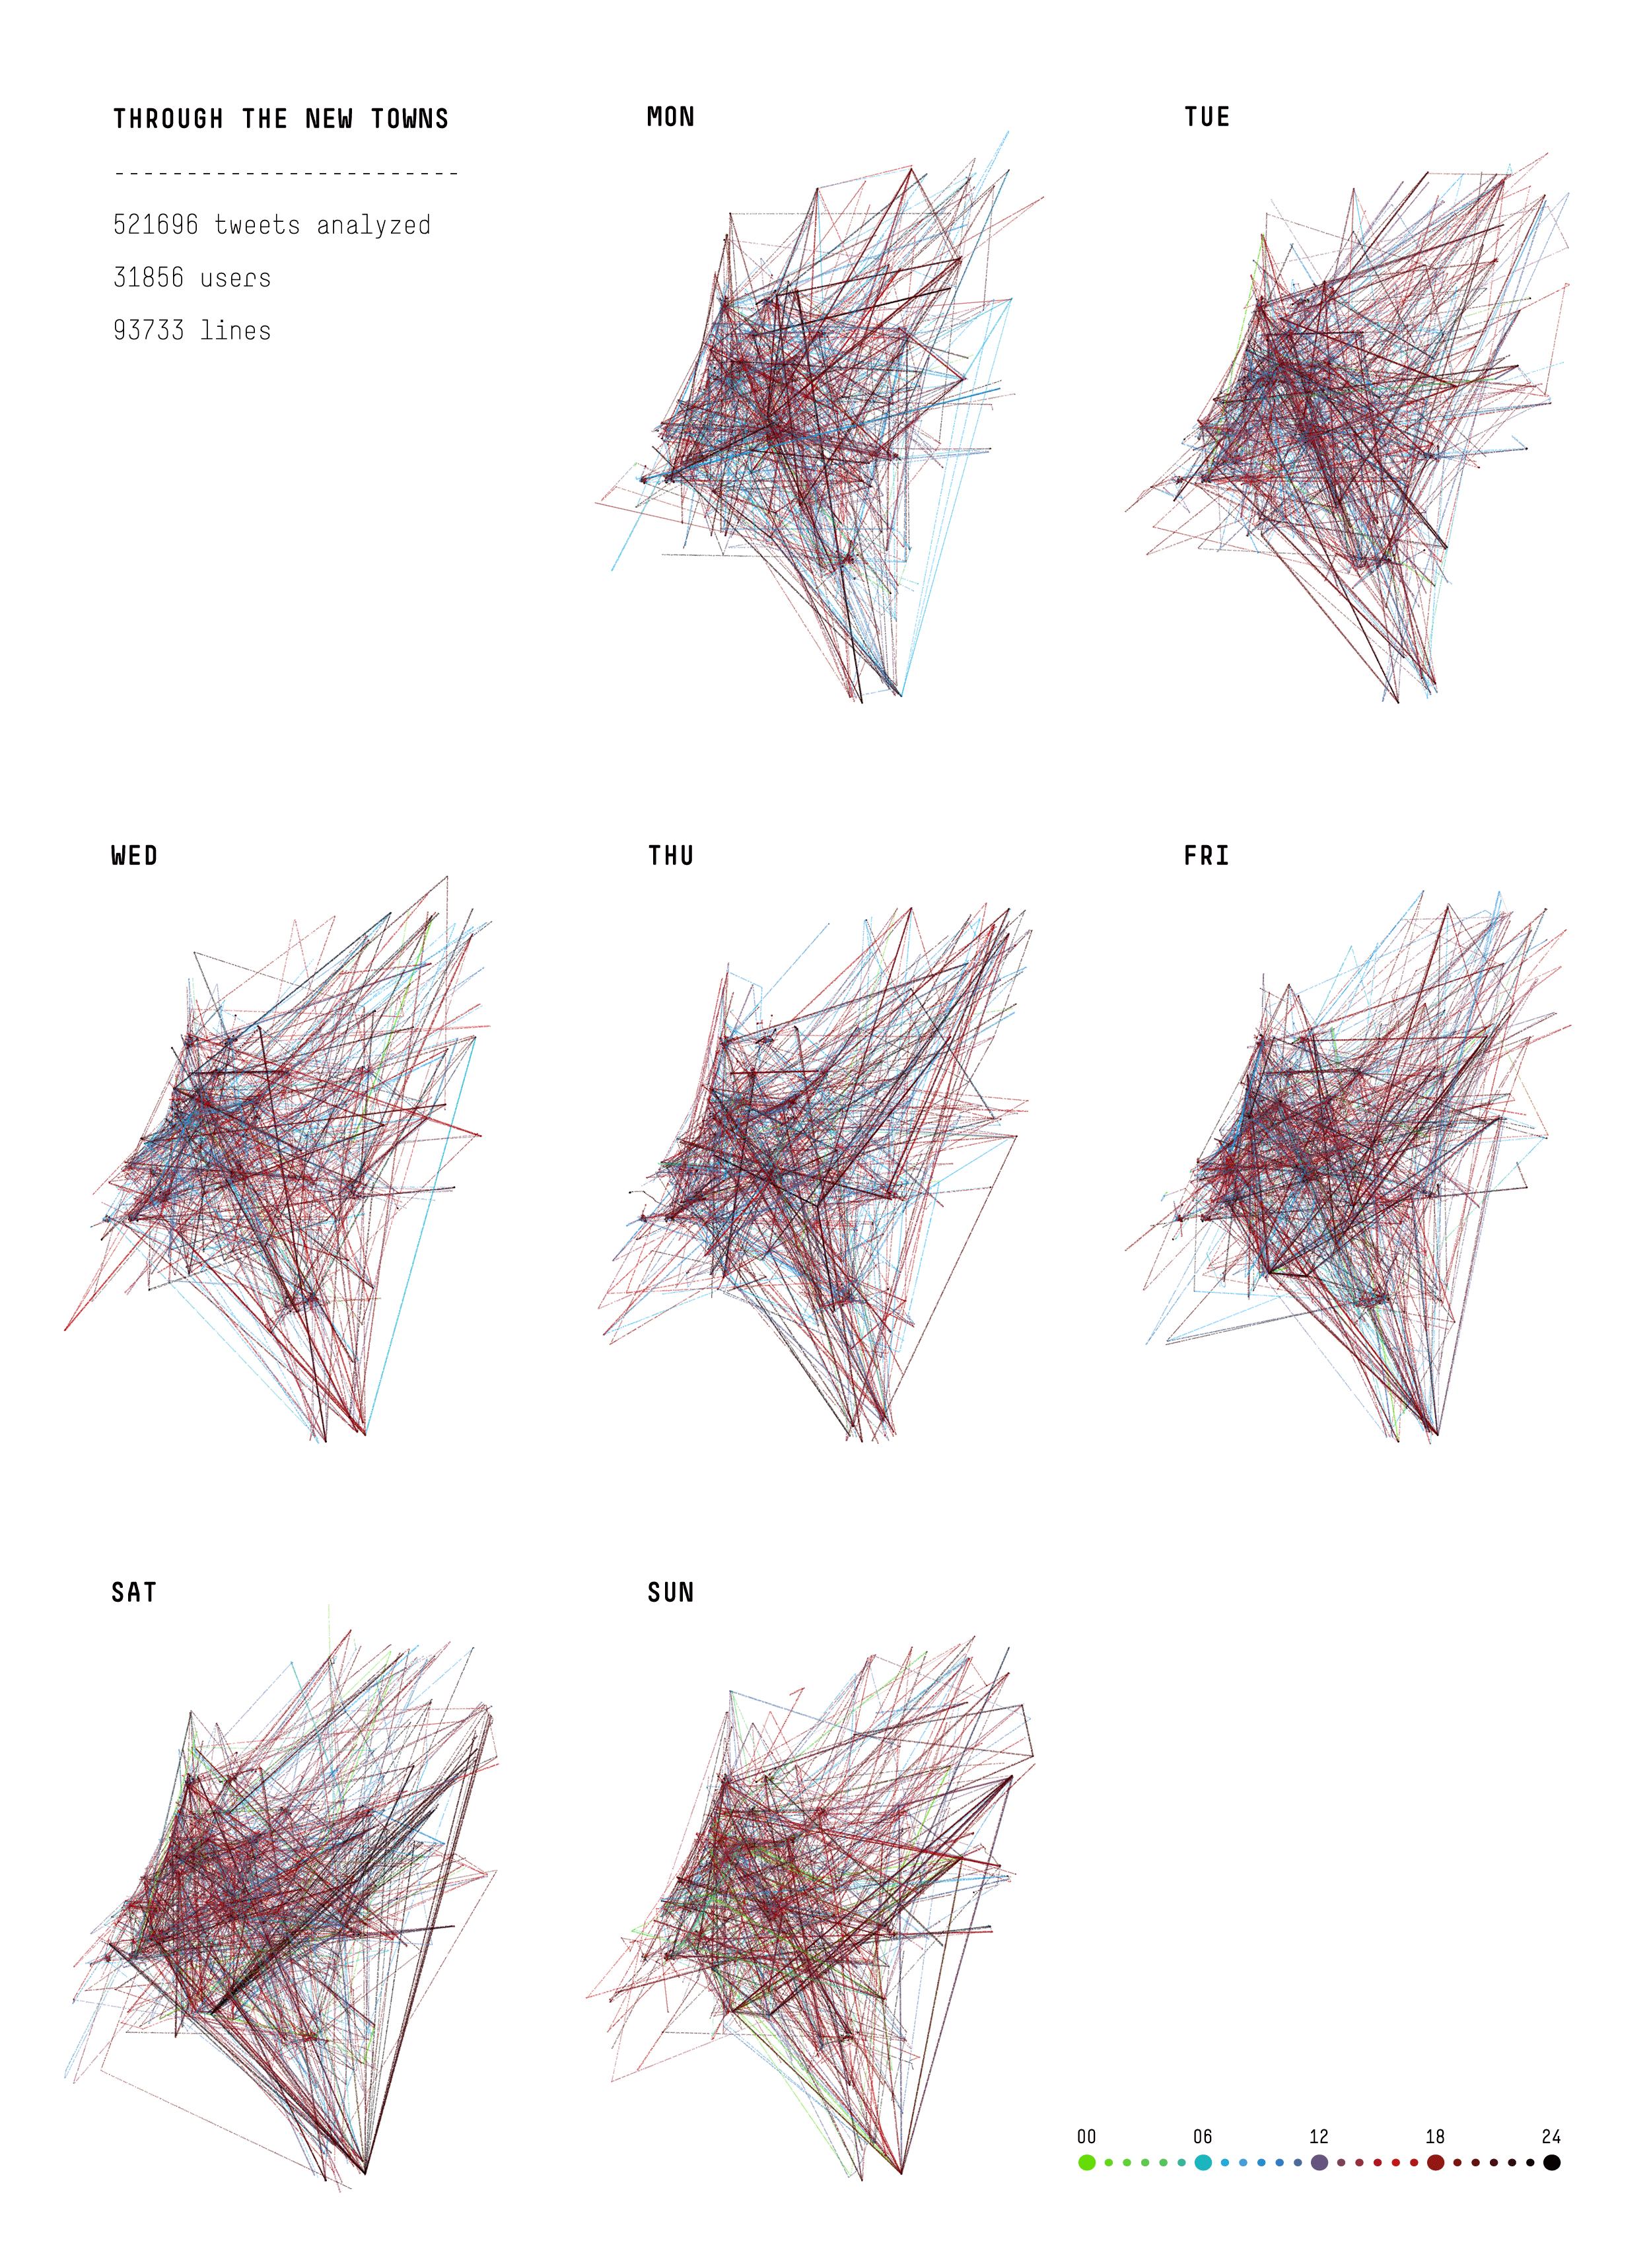
Data visualization and cover art for S+RO Magazine composed with 521696 geolocated tweets
Cover and data visualizations for the 2/2013 issue of Dutch magazine Stedenbouw + Ruimtelijke Ordening. The theme of the issue is New Towns, also called planned communities. I worked on this project during my thesis at LUST with the help of Jeroen Barendse, Edwin Jakobs and Thomas Castro.
TRACES
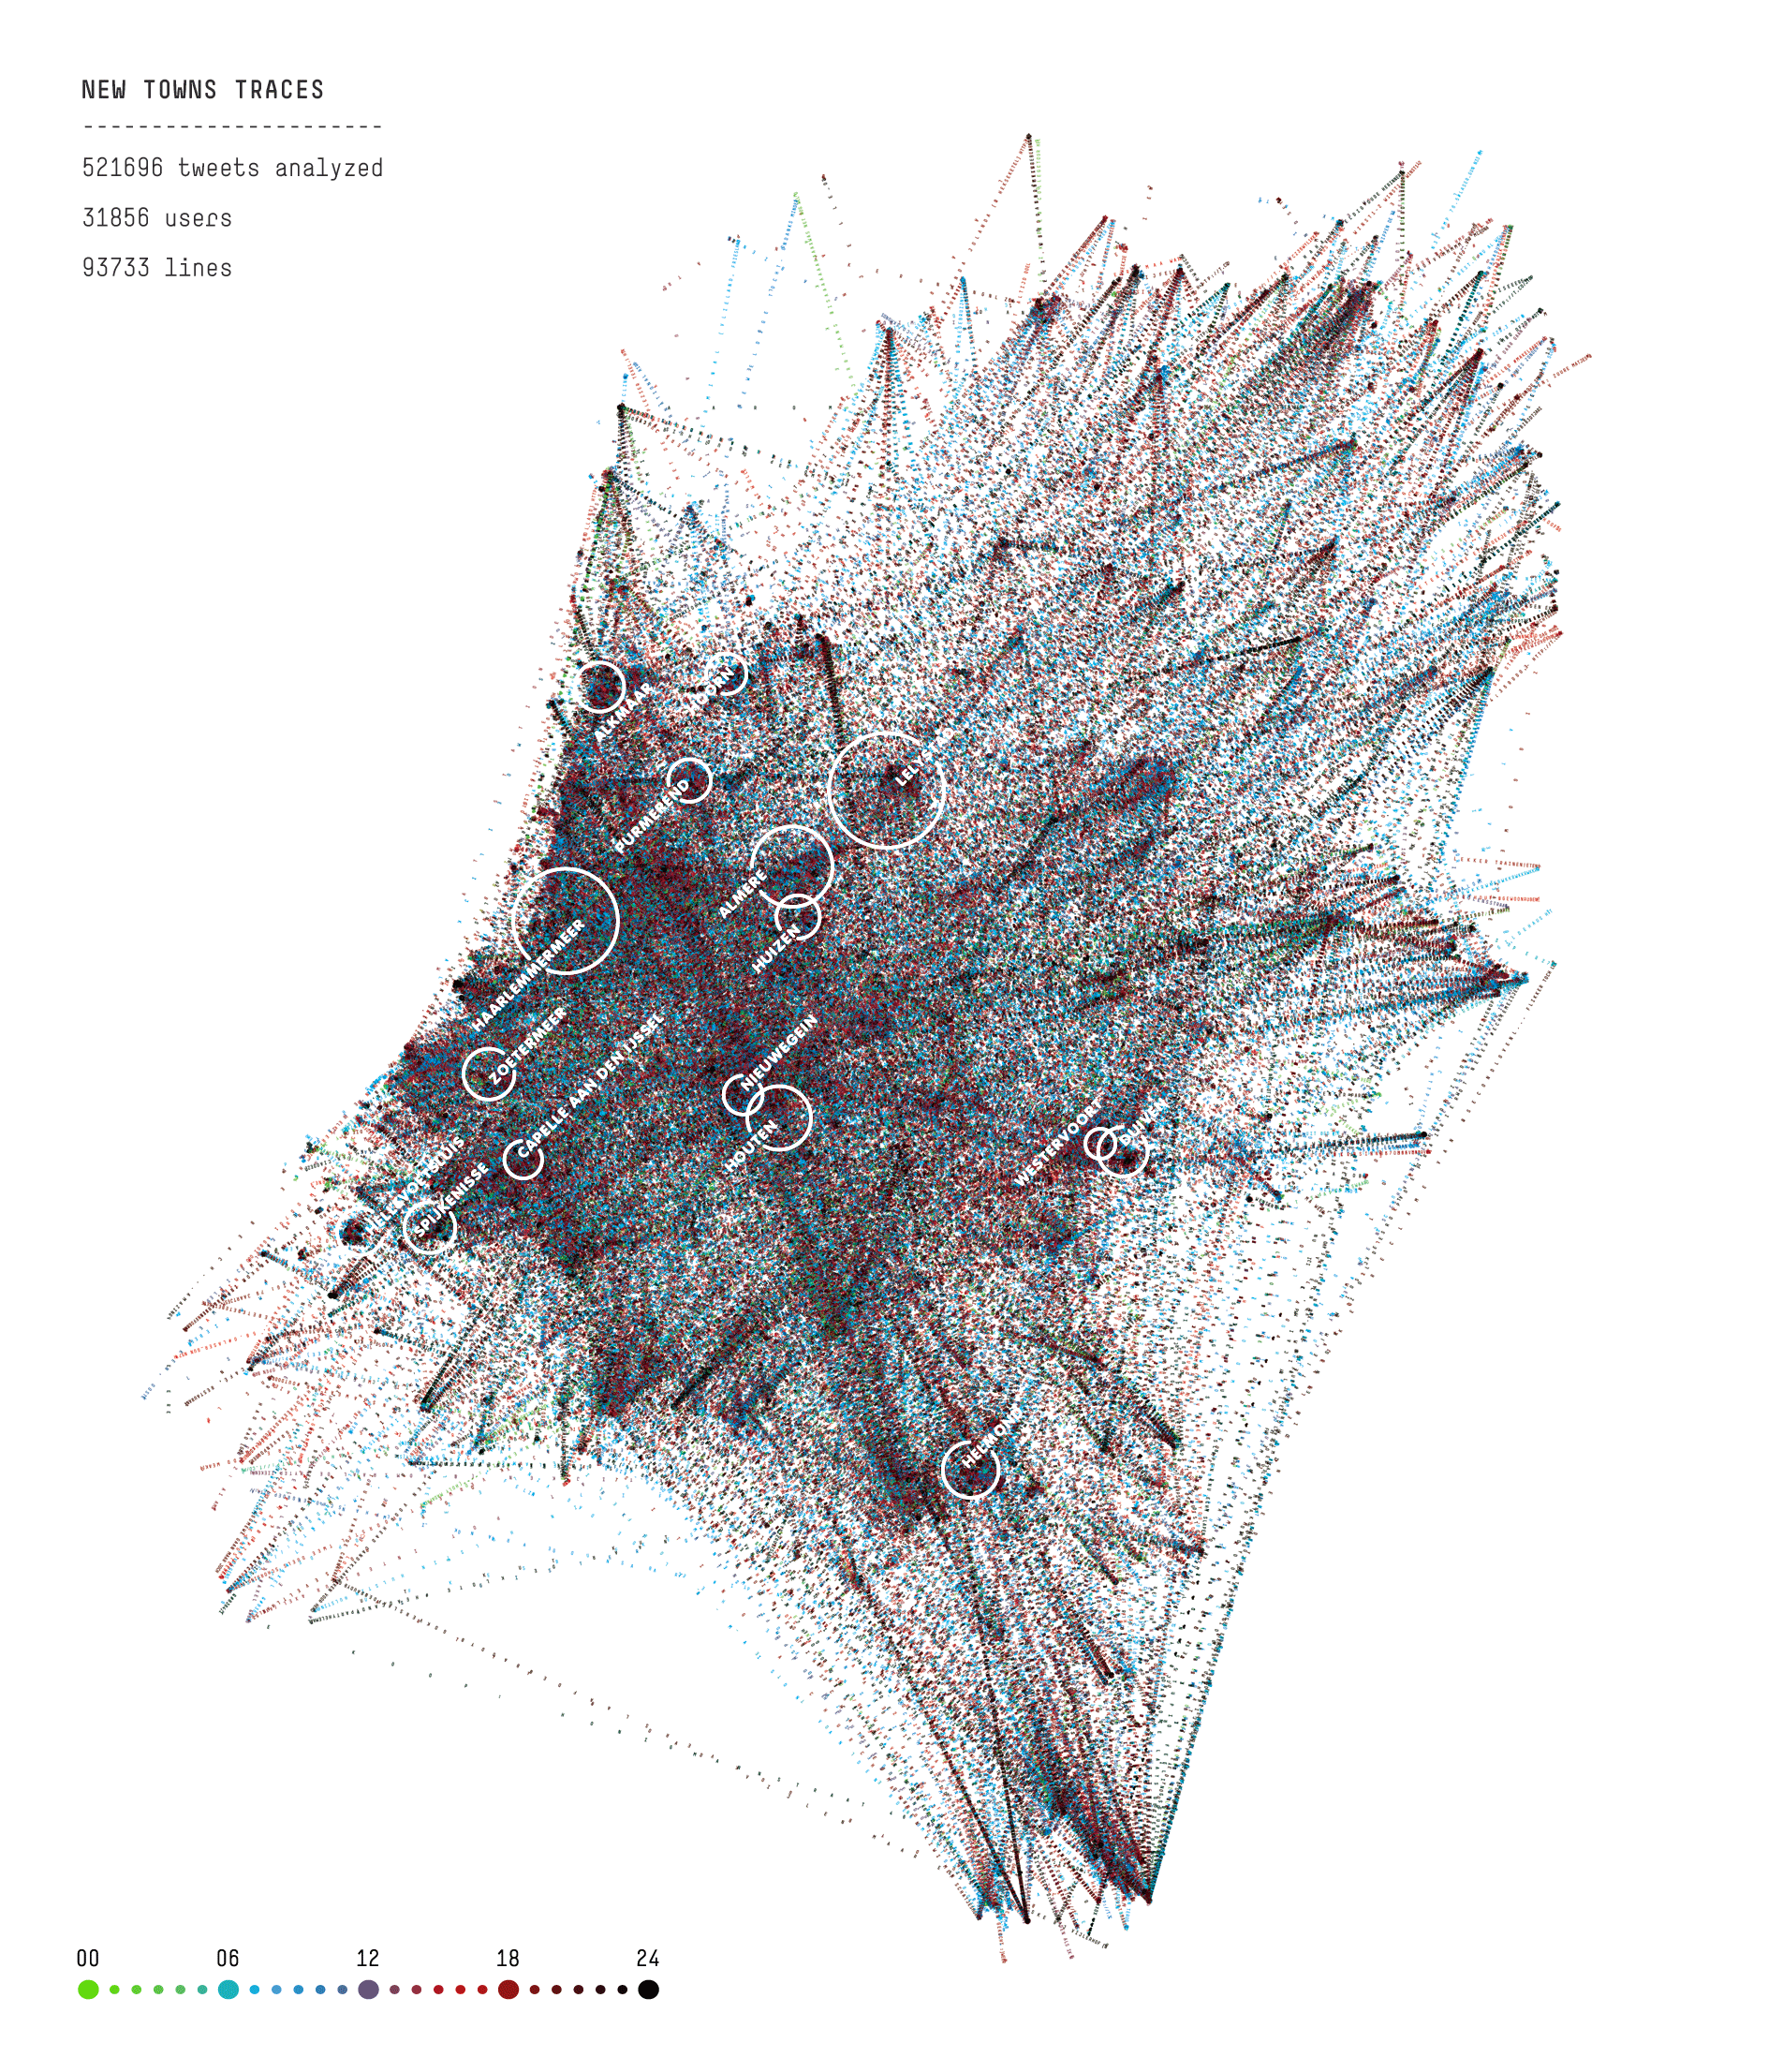
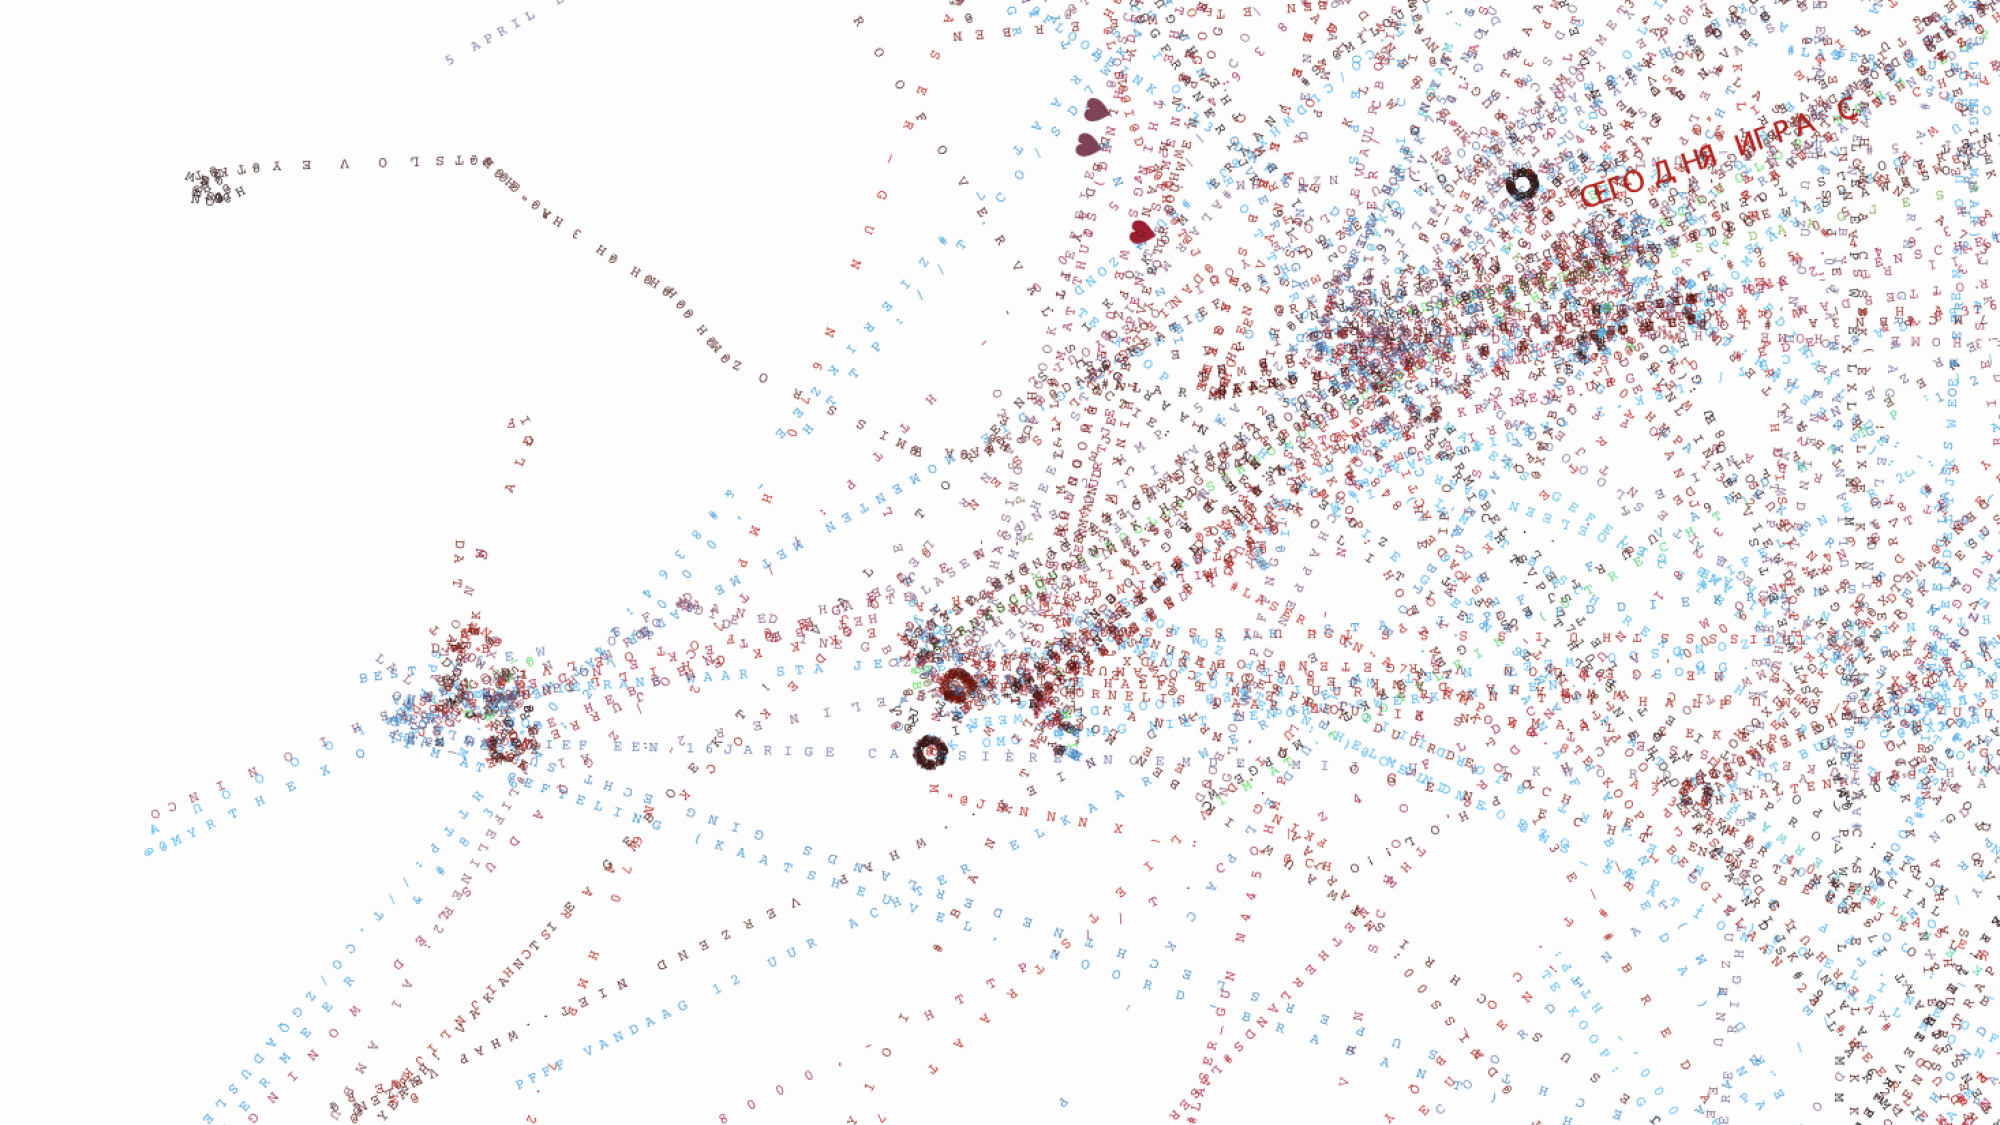
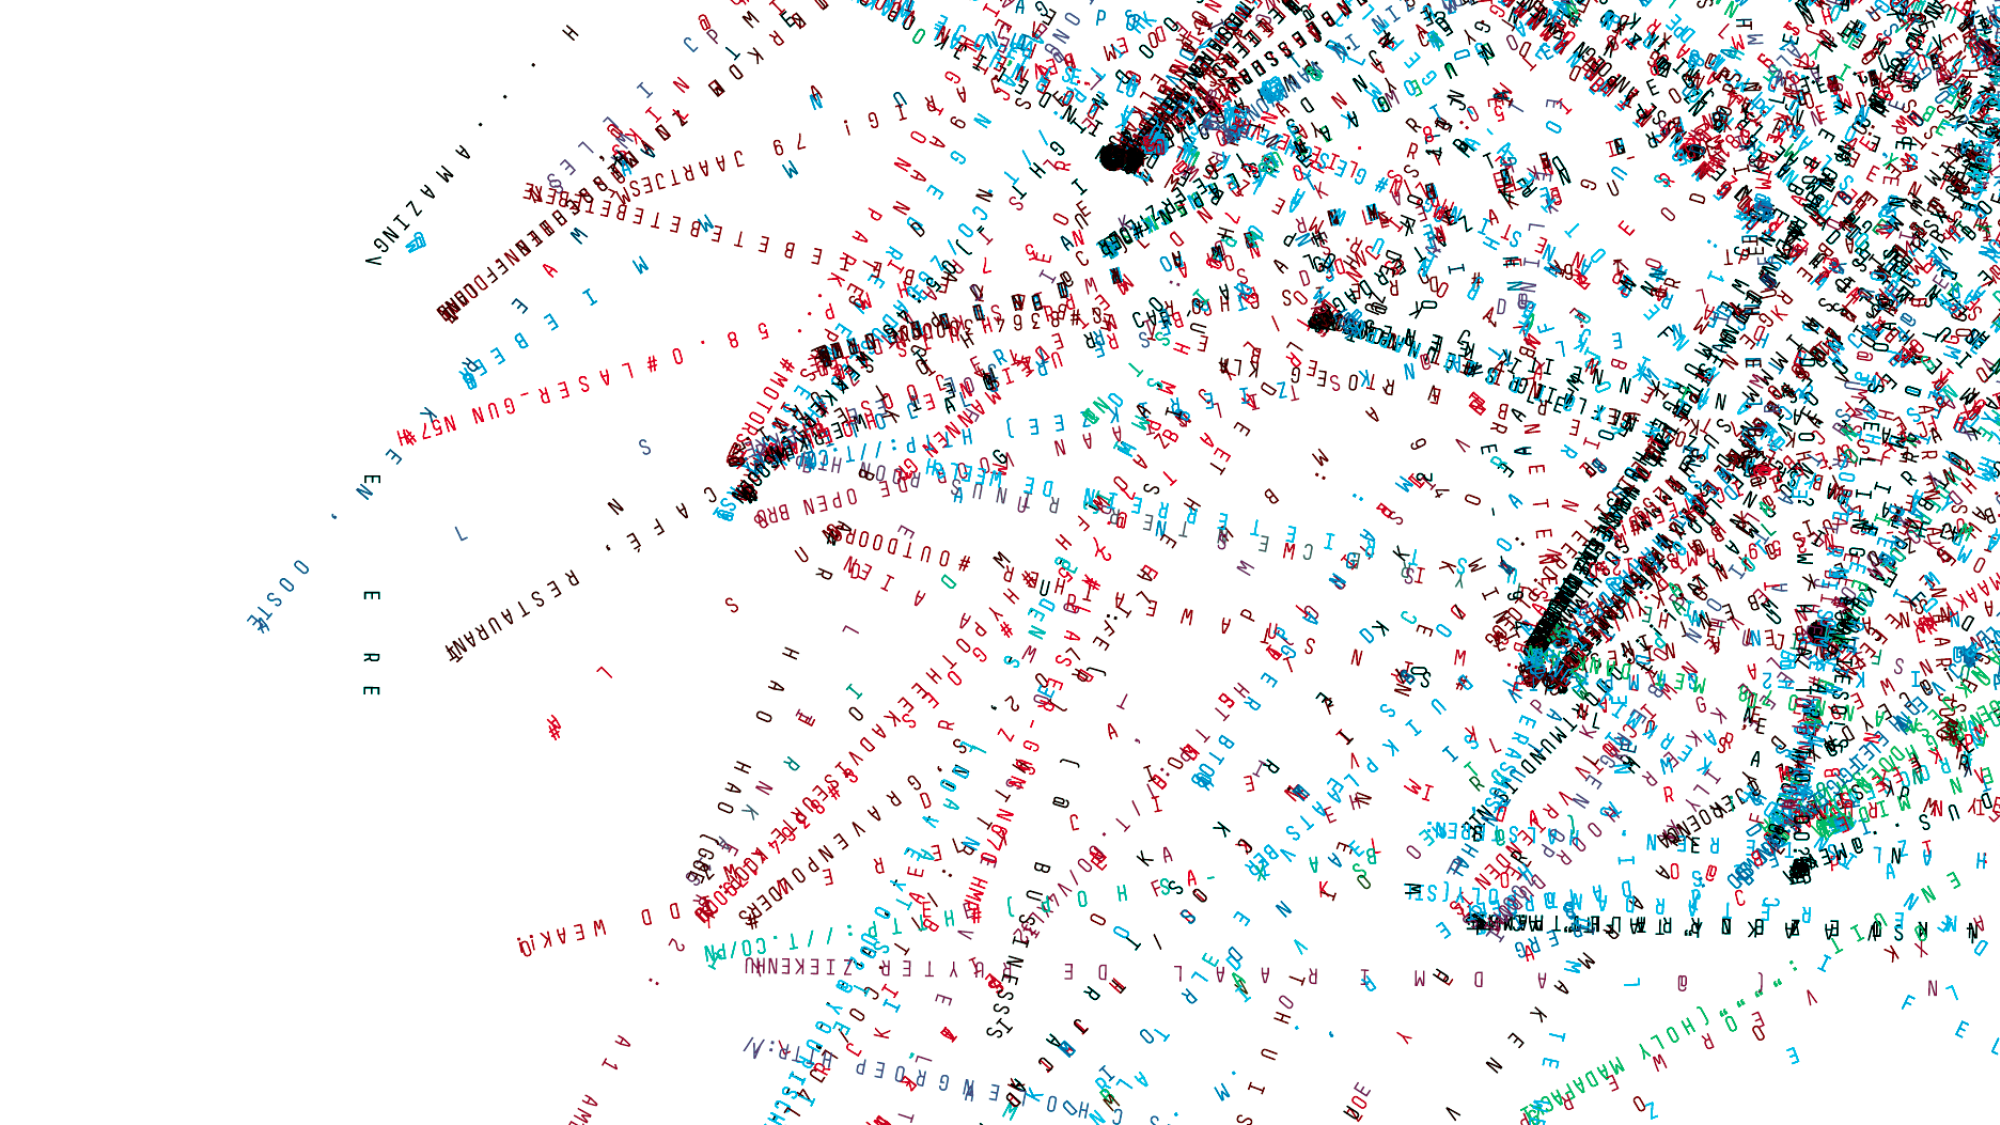
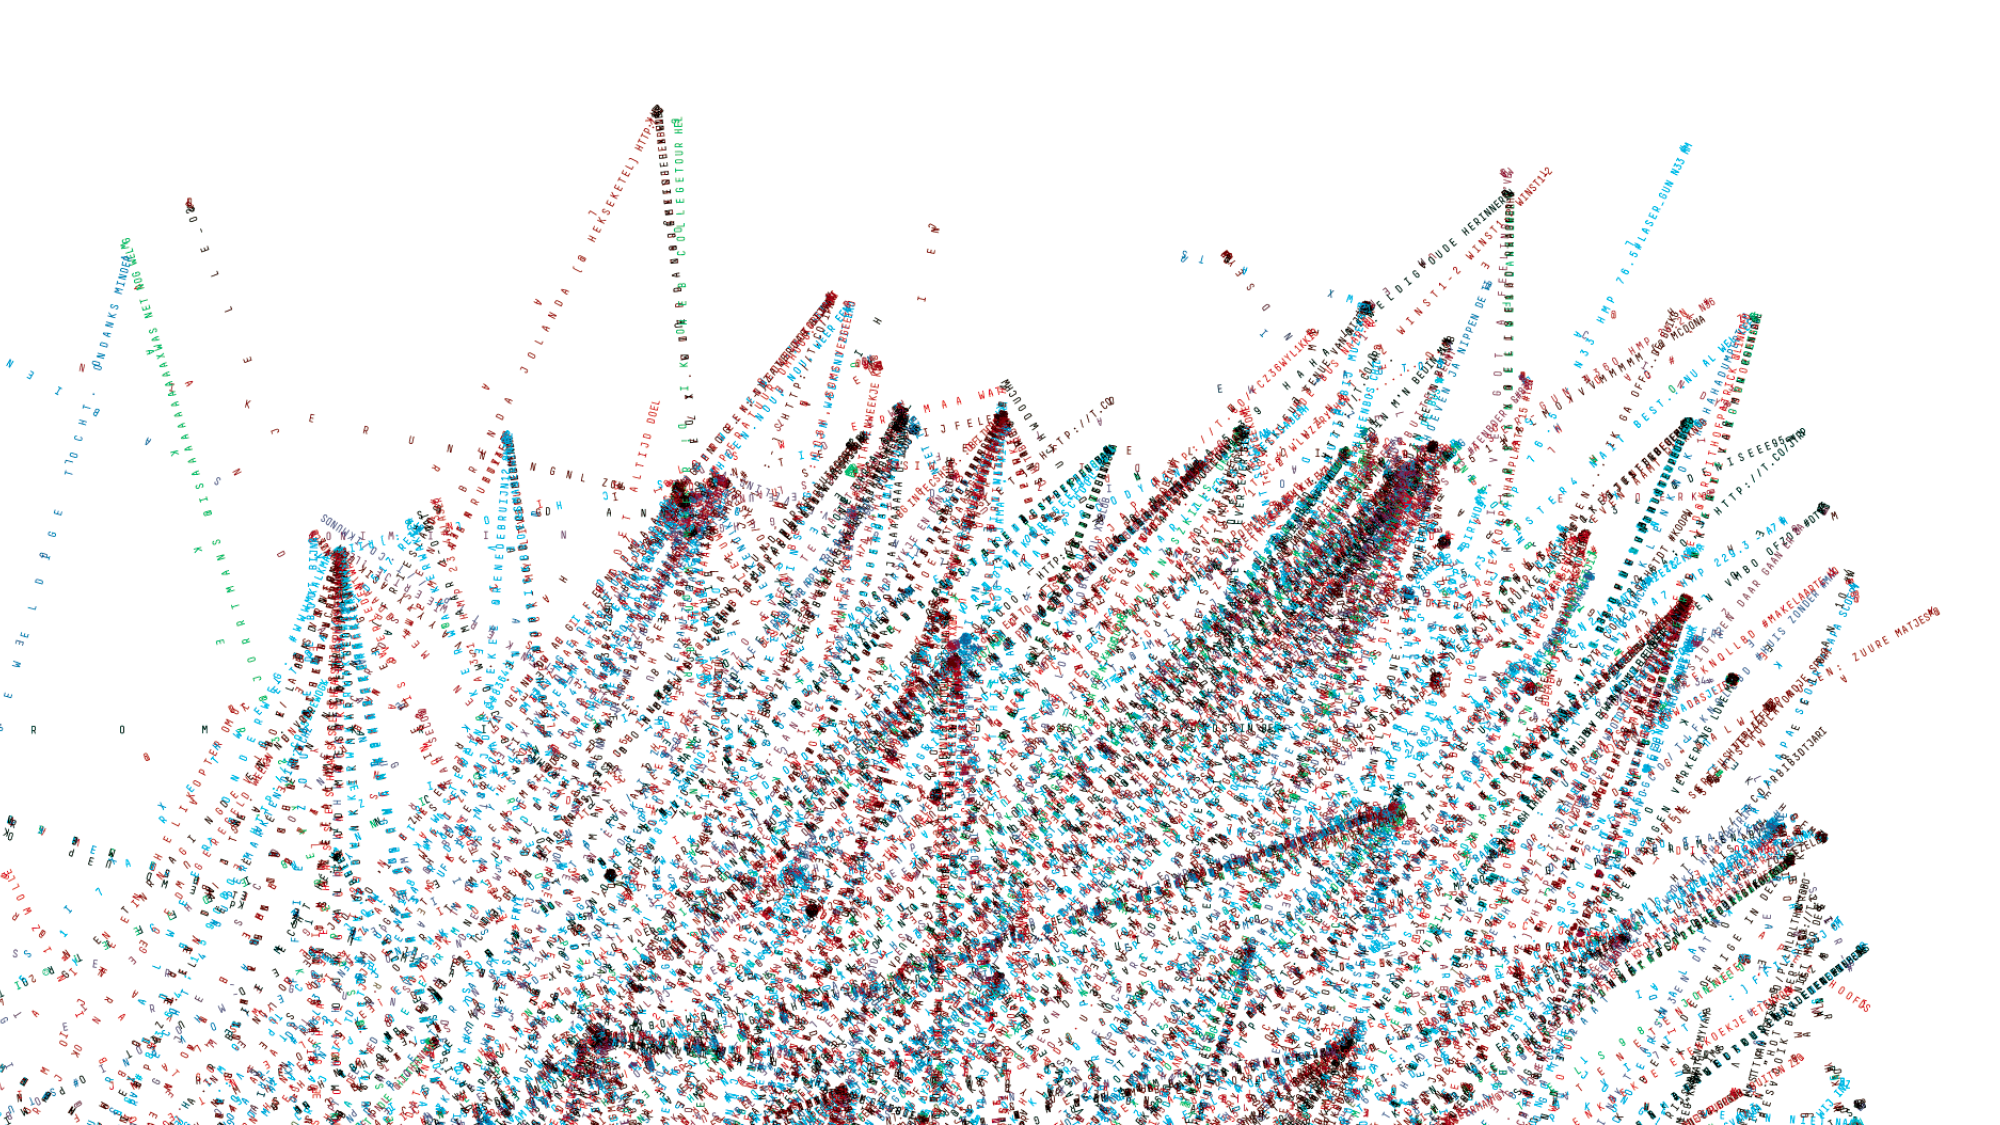
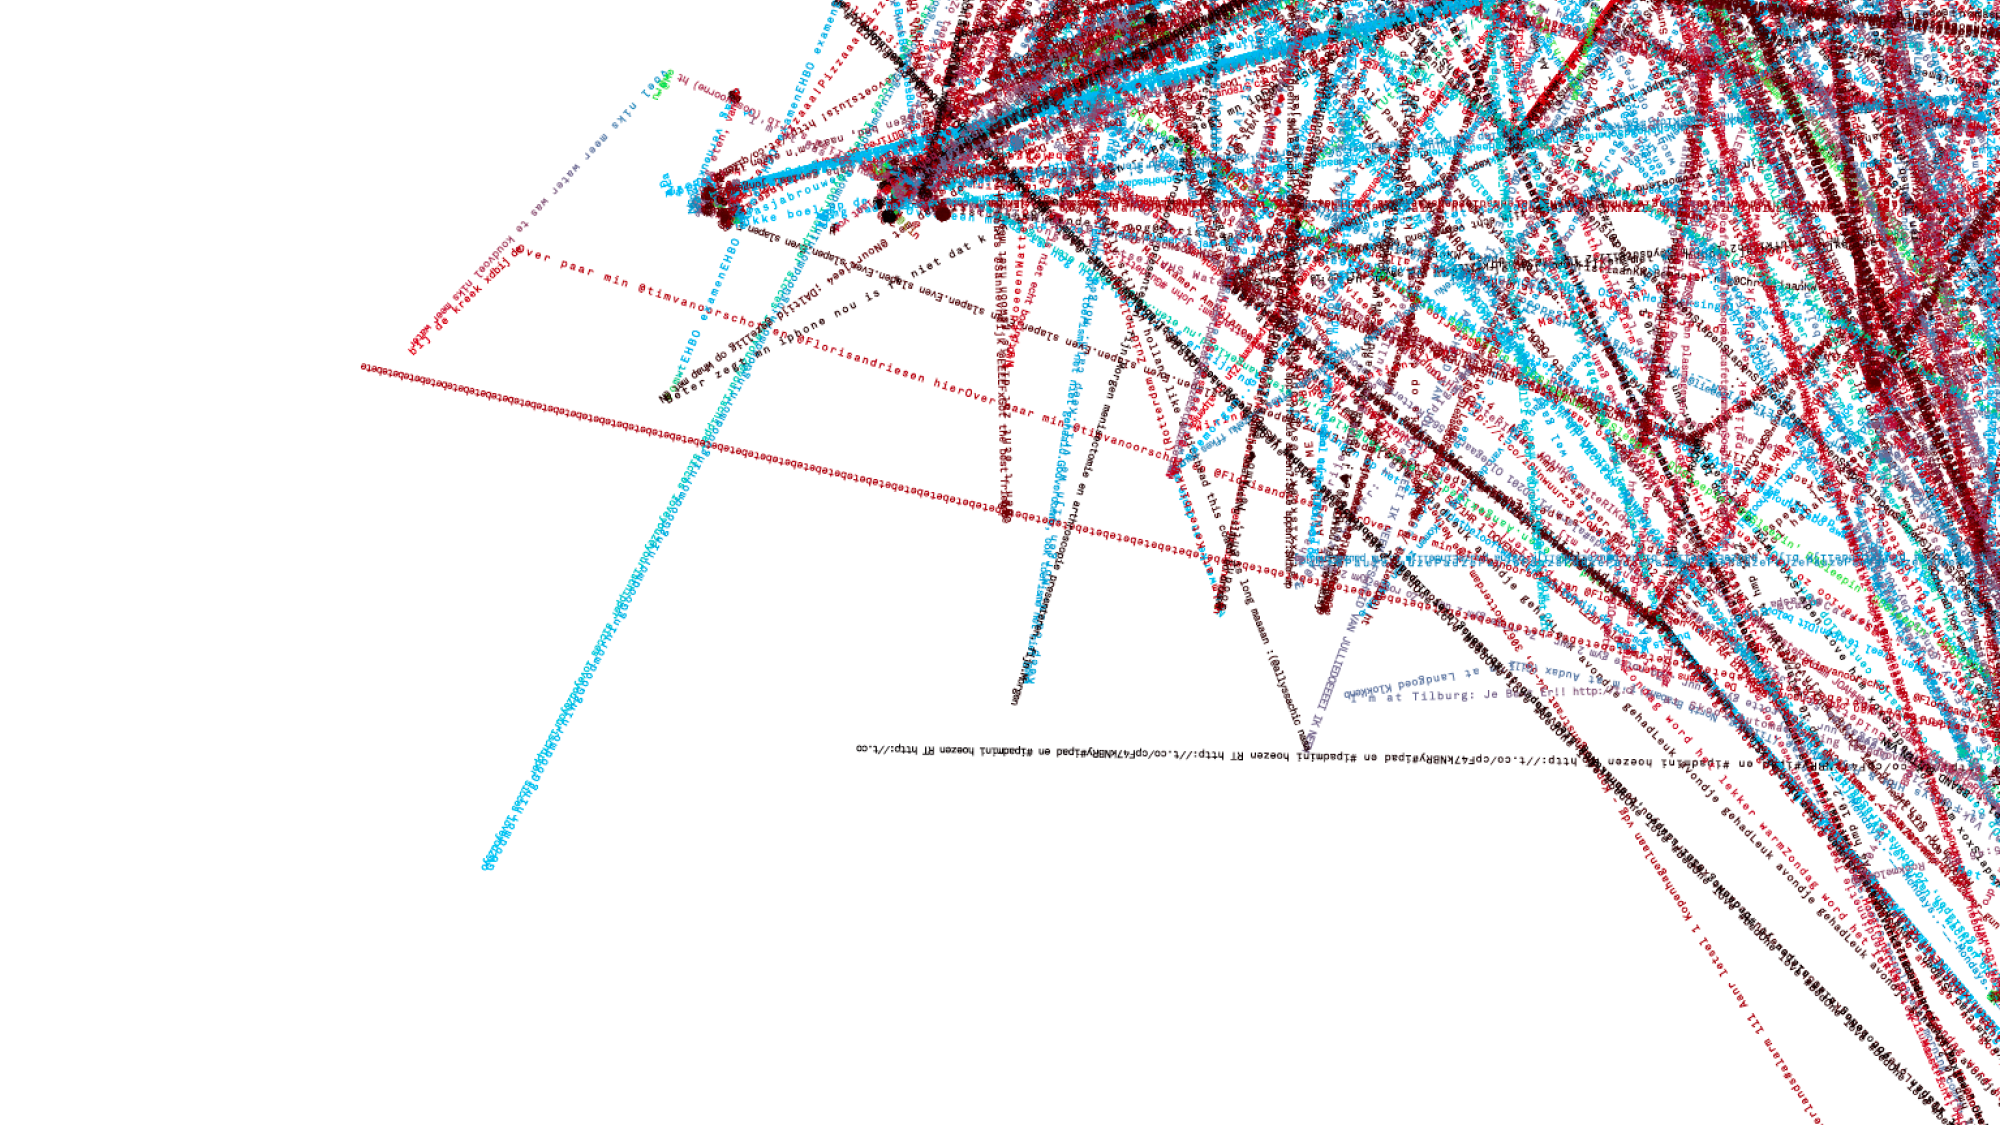
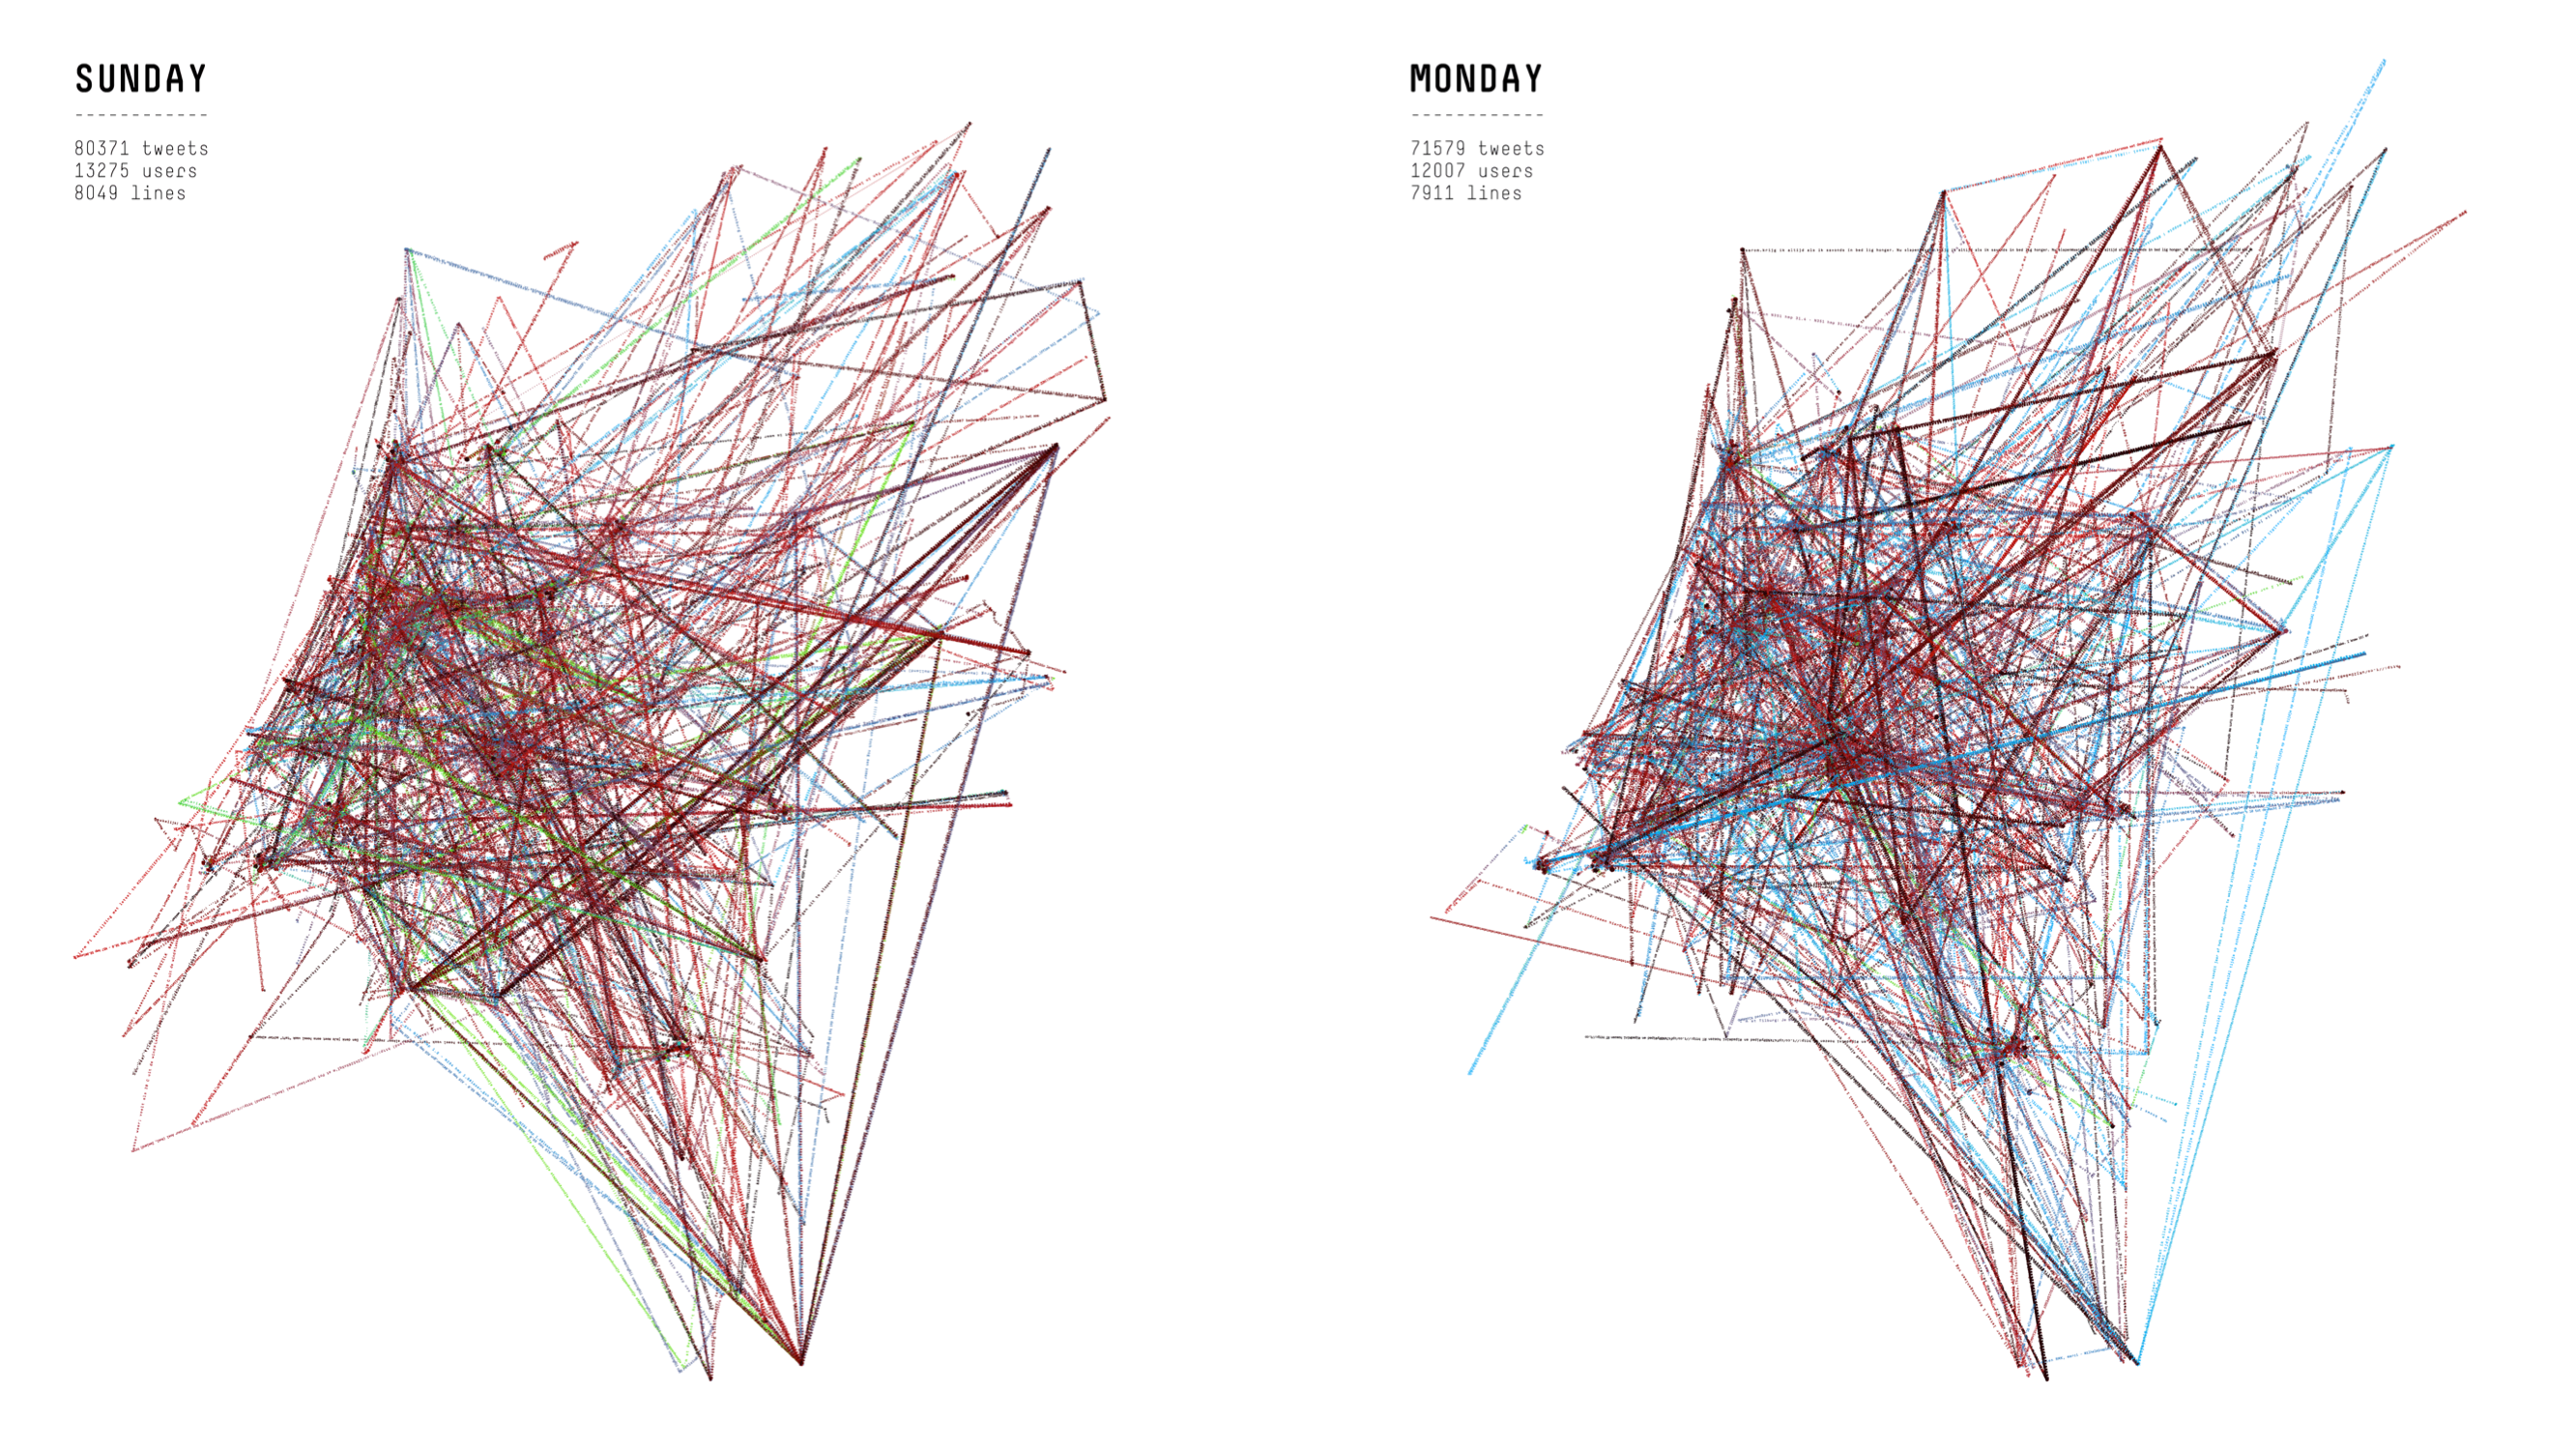
For this piece we analized a dataset of about half million geolocalized tweets collected over a week. After filtering out only tweets by users that are related to one or more Dutch New Towns, we plotted them using these simple rules: the locations of tweets from the same user are connected, the connections are made using the text of the tweets, the color-coding indicates the time of the day (0—24) when the tweet was posted. In this way, the conversations of people related to these towns create a typographic cloud shaped like the country.
NEW TOWNS
The policy for the former growing centers has constantly been accompanied by discussions about what their suburbs actually are. The new cities are in fact originated in the tension between urbanity and sub-urbanity. The dominant discourse is that they are not urban enough. There has been much criticism of their lack of urban amenities, identity and historical and spatial layering. Another, more recent discourse is about decay: a gradual process of decline has be observed in the new towns. But despite their bad reputation with outsiders, most residents of the New Towns seem to be satisfied, as suggested by a number of urban sociological studies in Zoetermeer, Nieuwegein and Almere.
Text from lust.nl
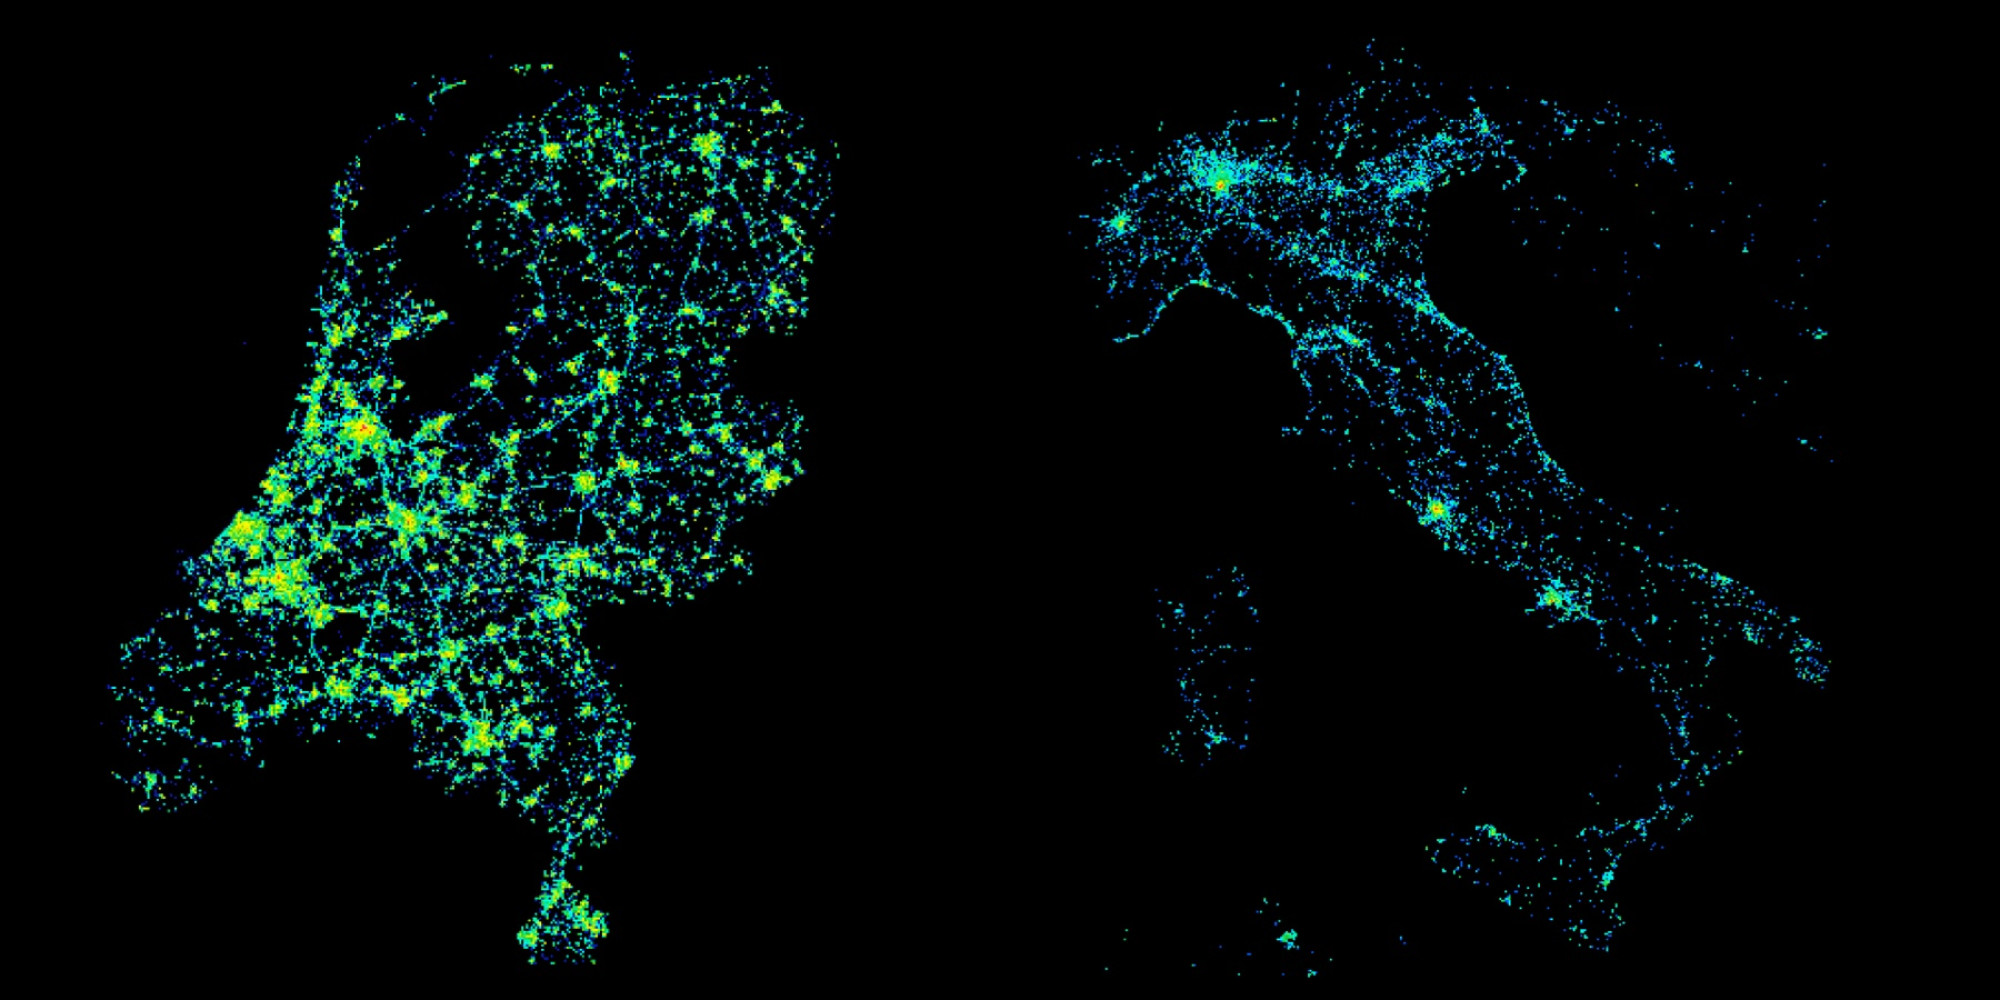
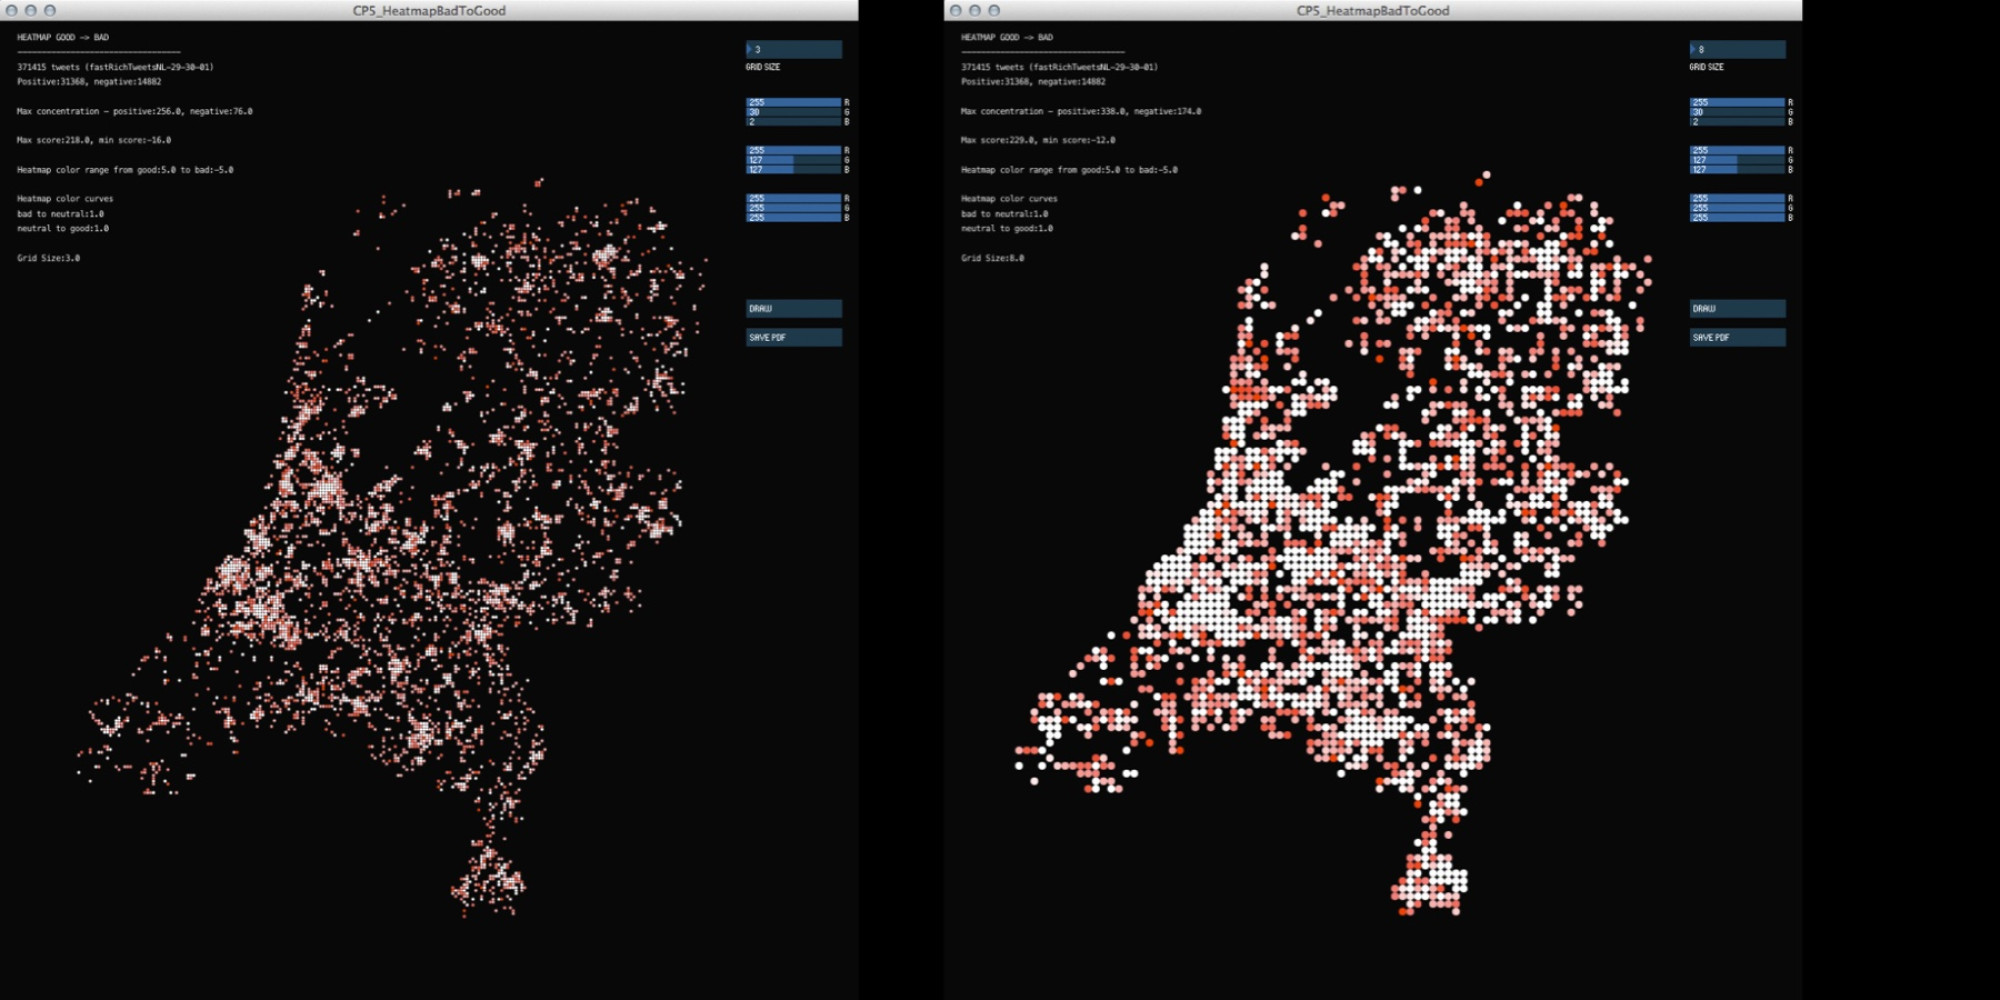
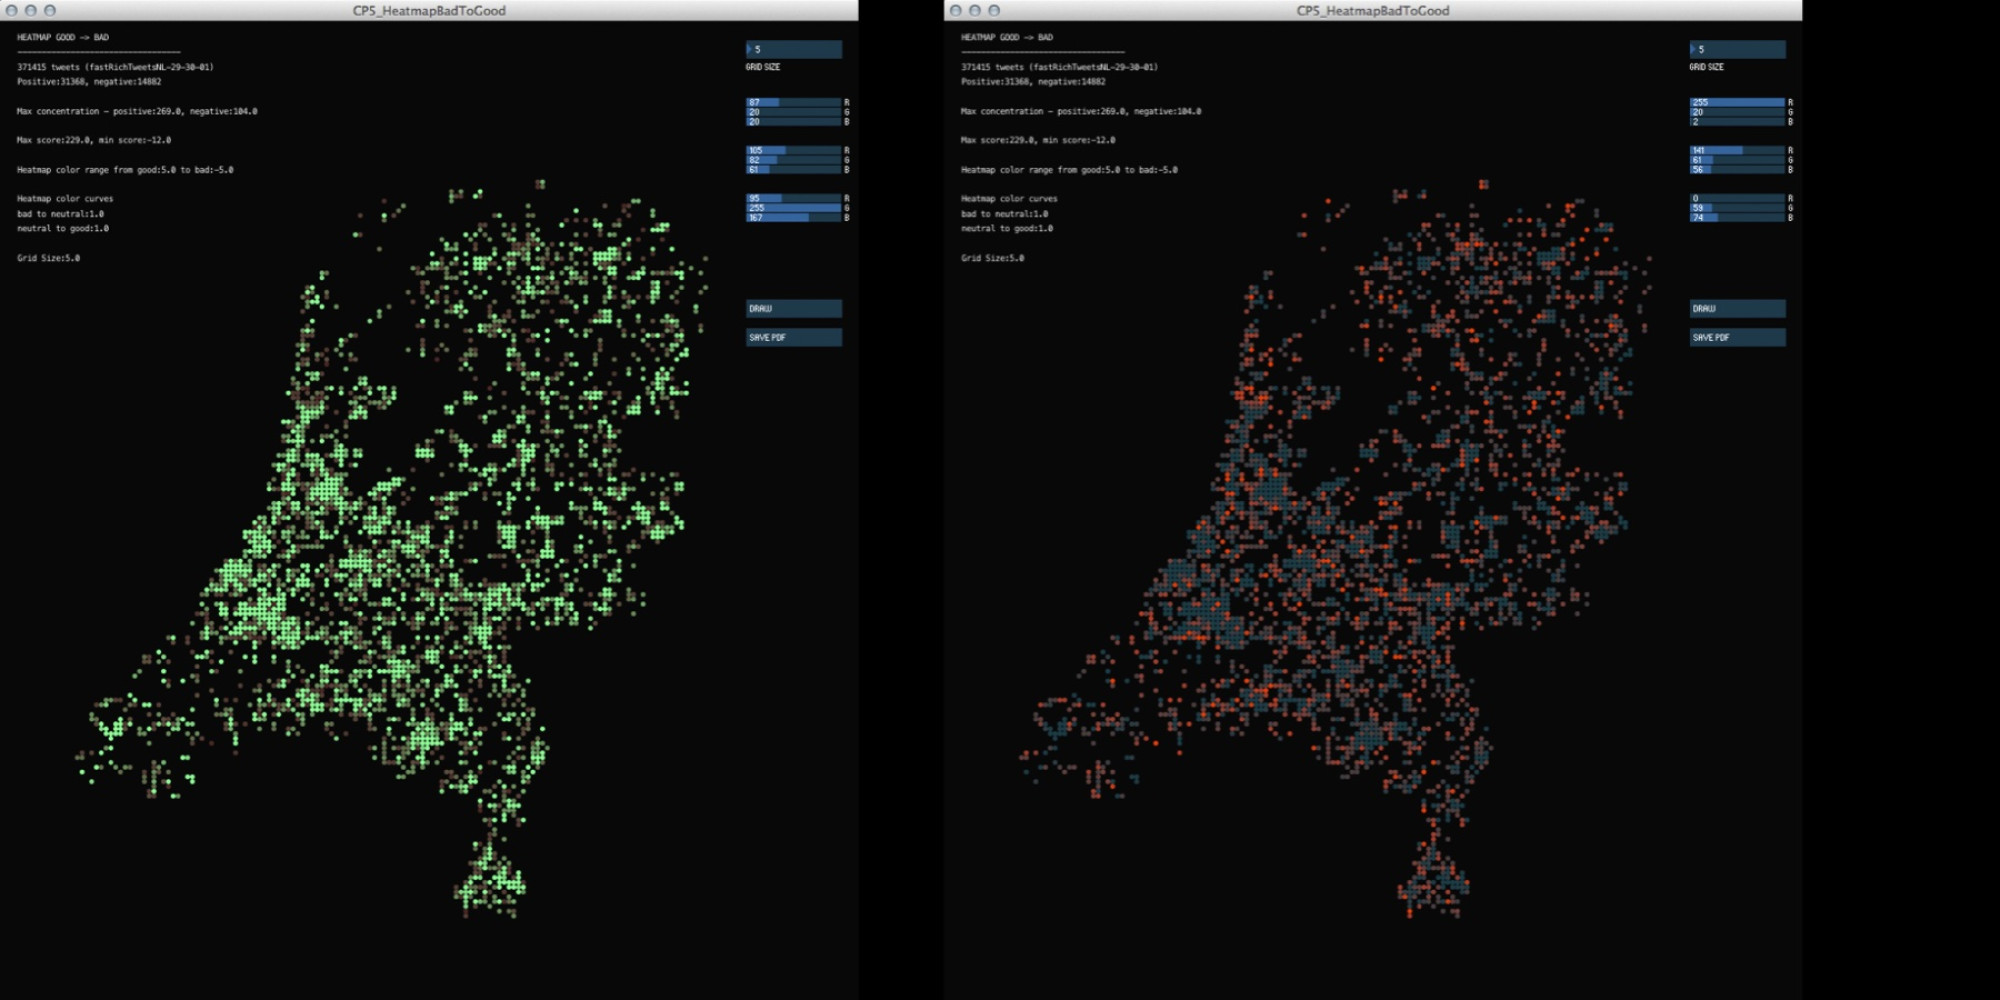
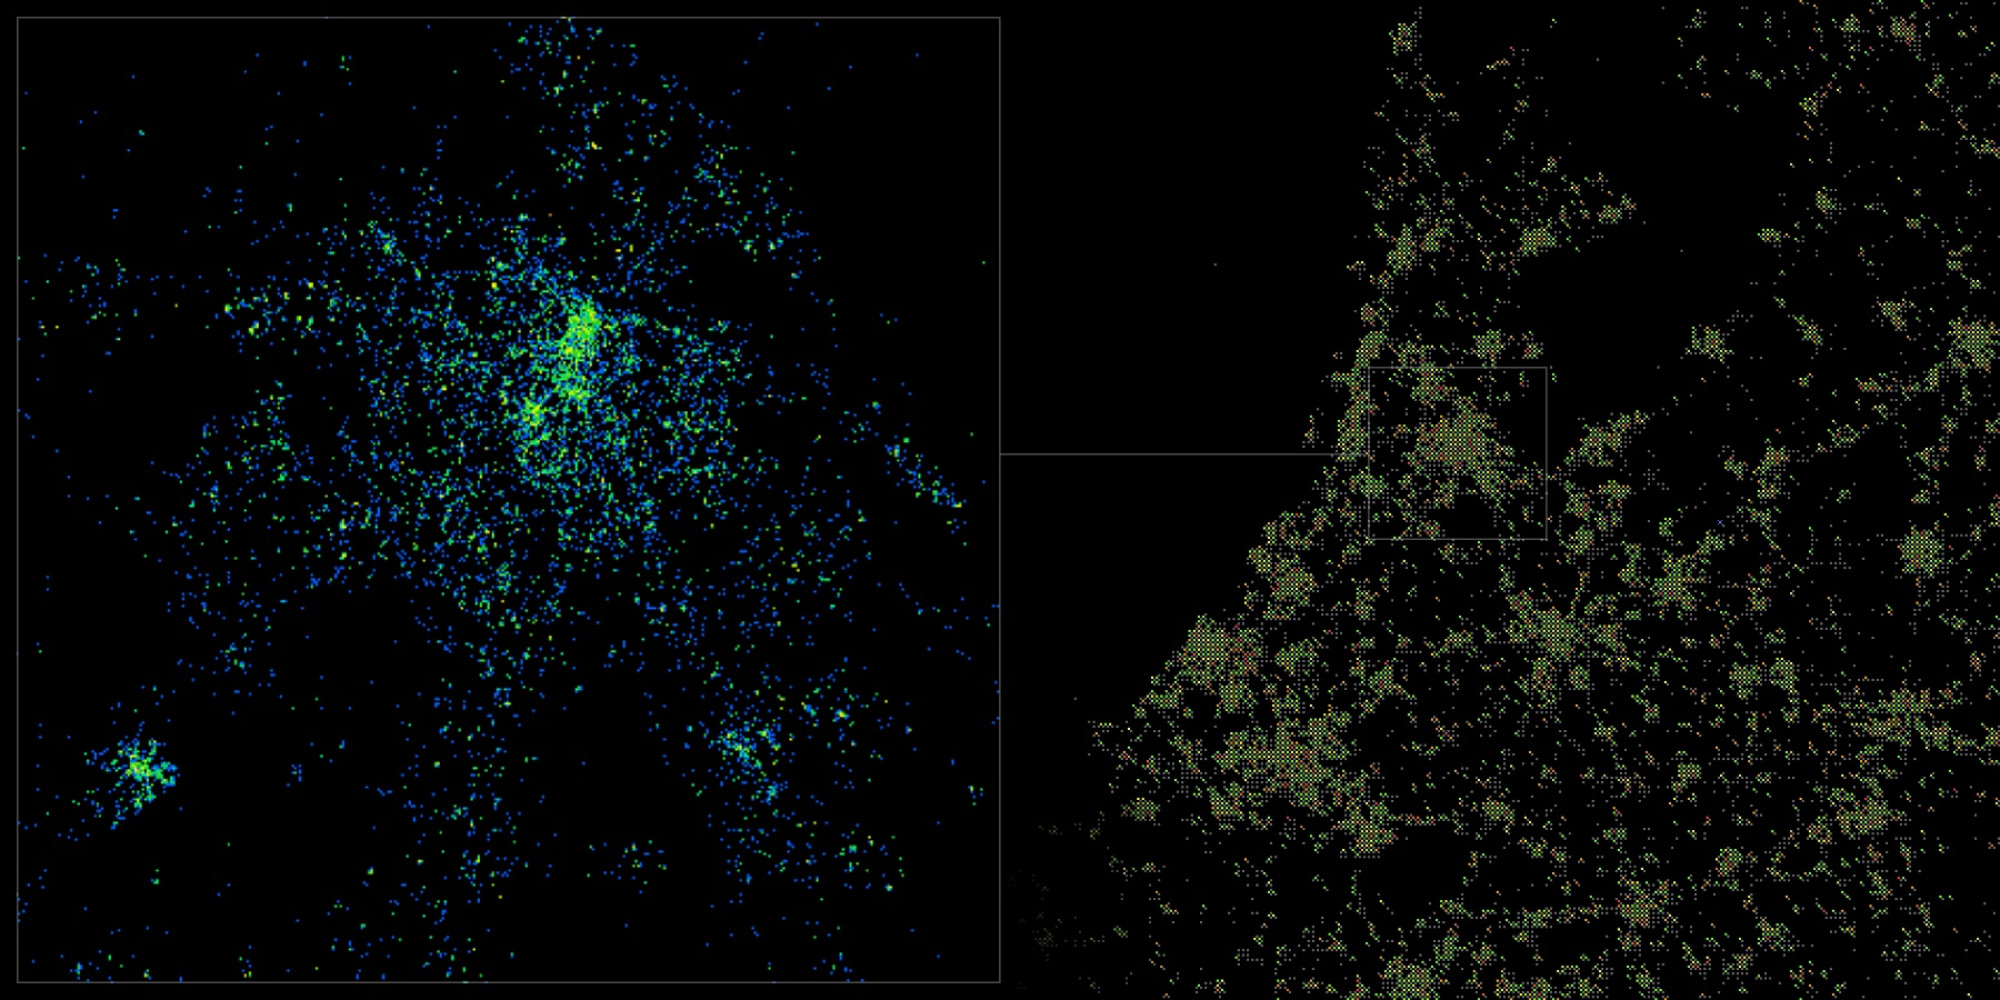
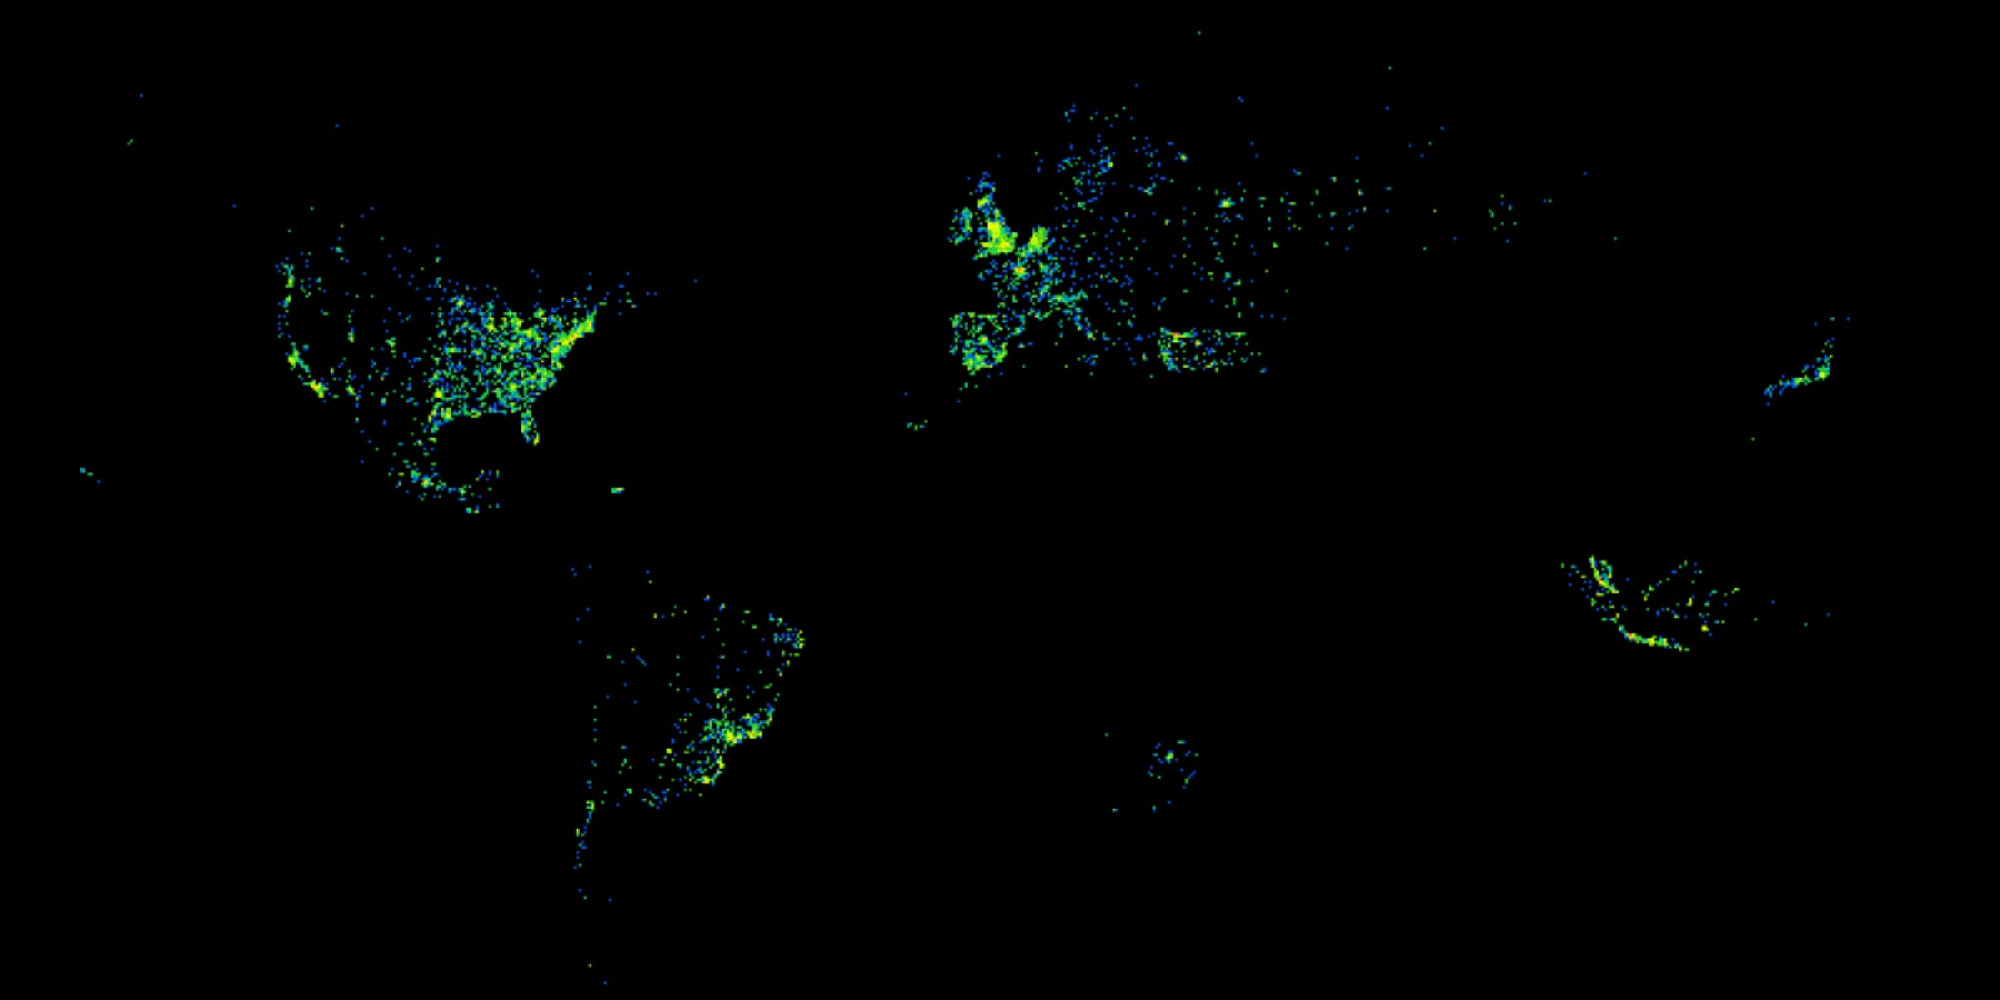
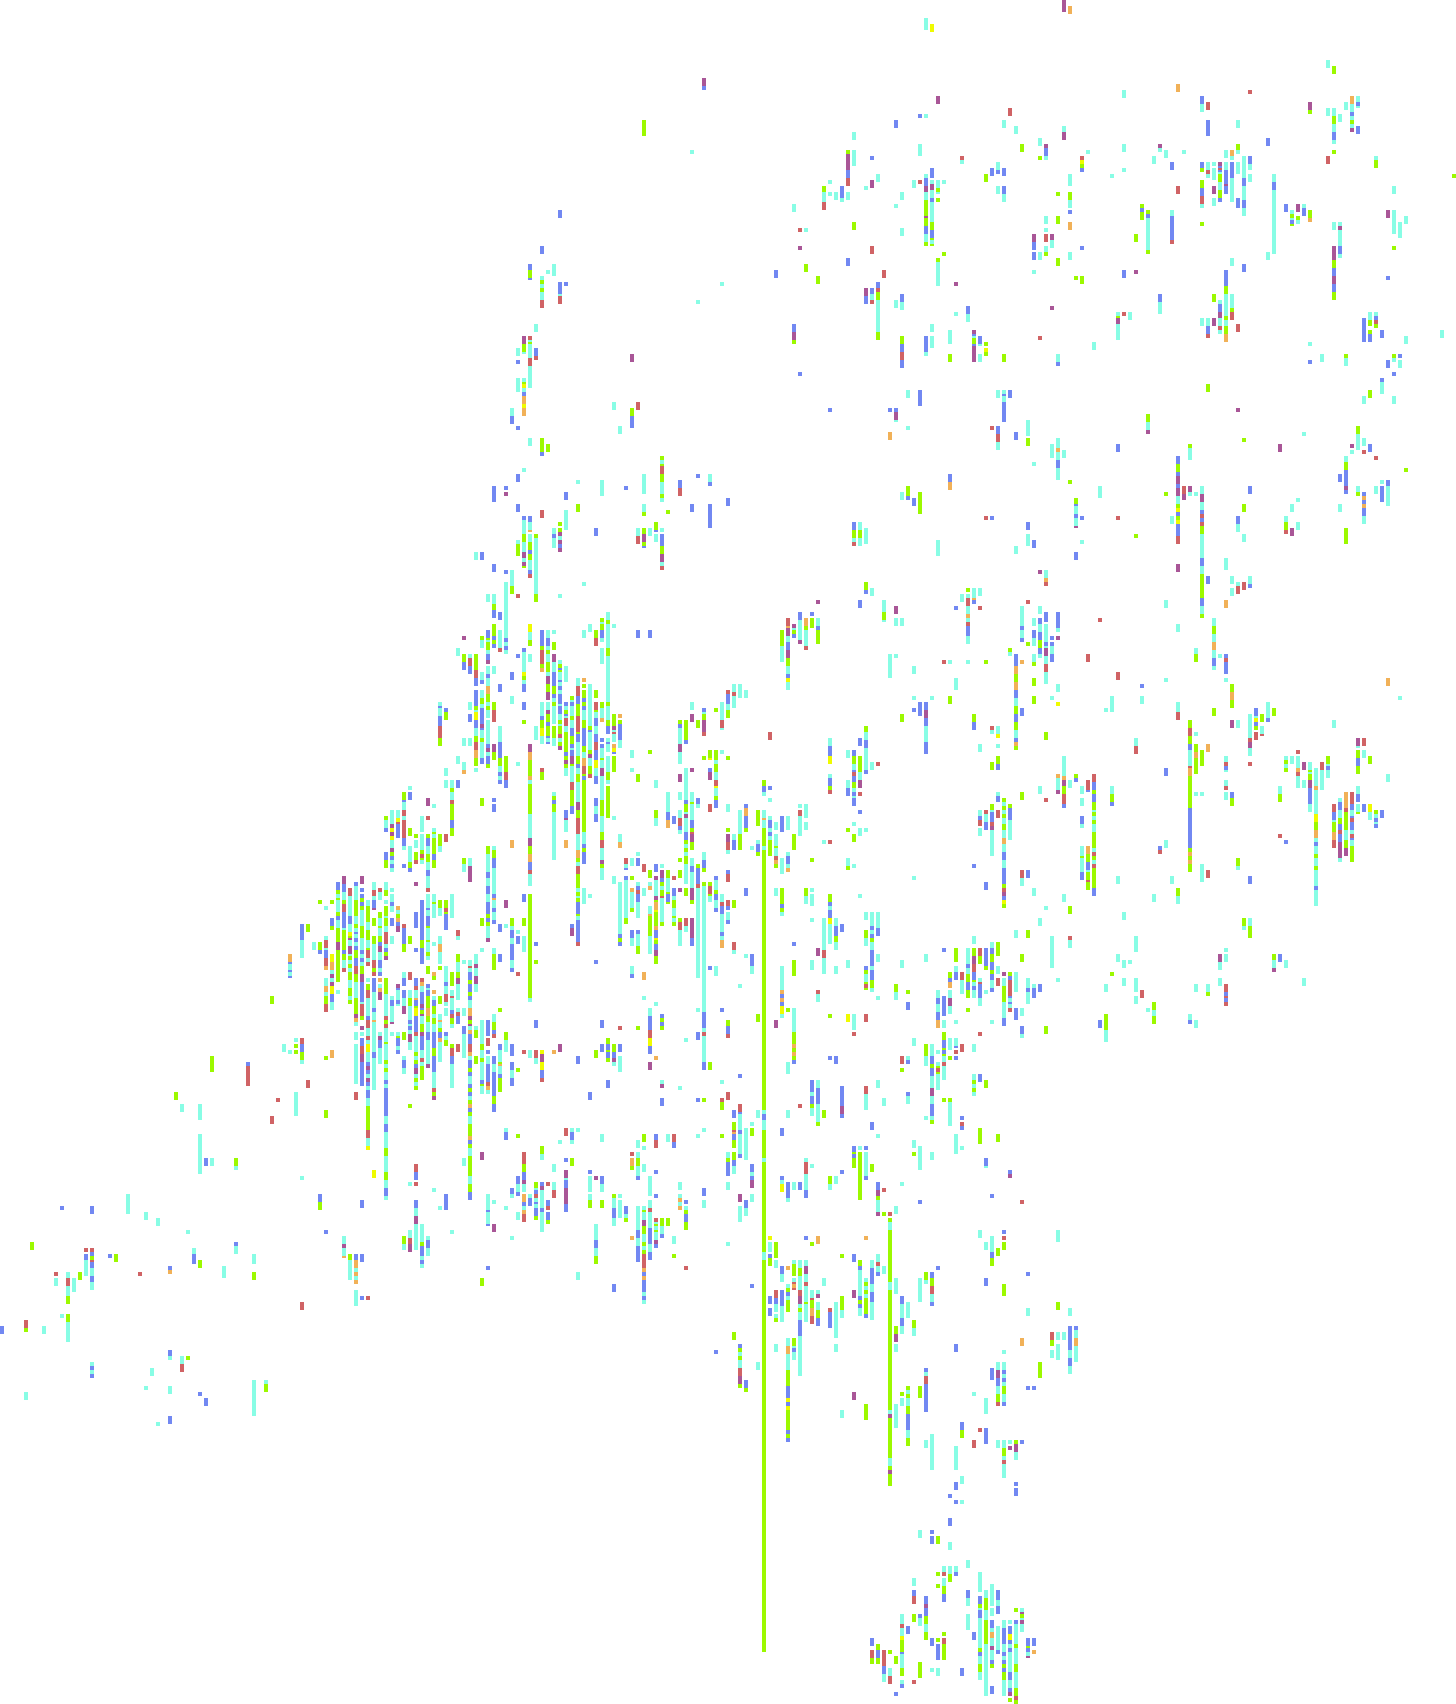
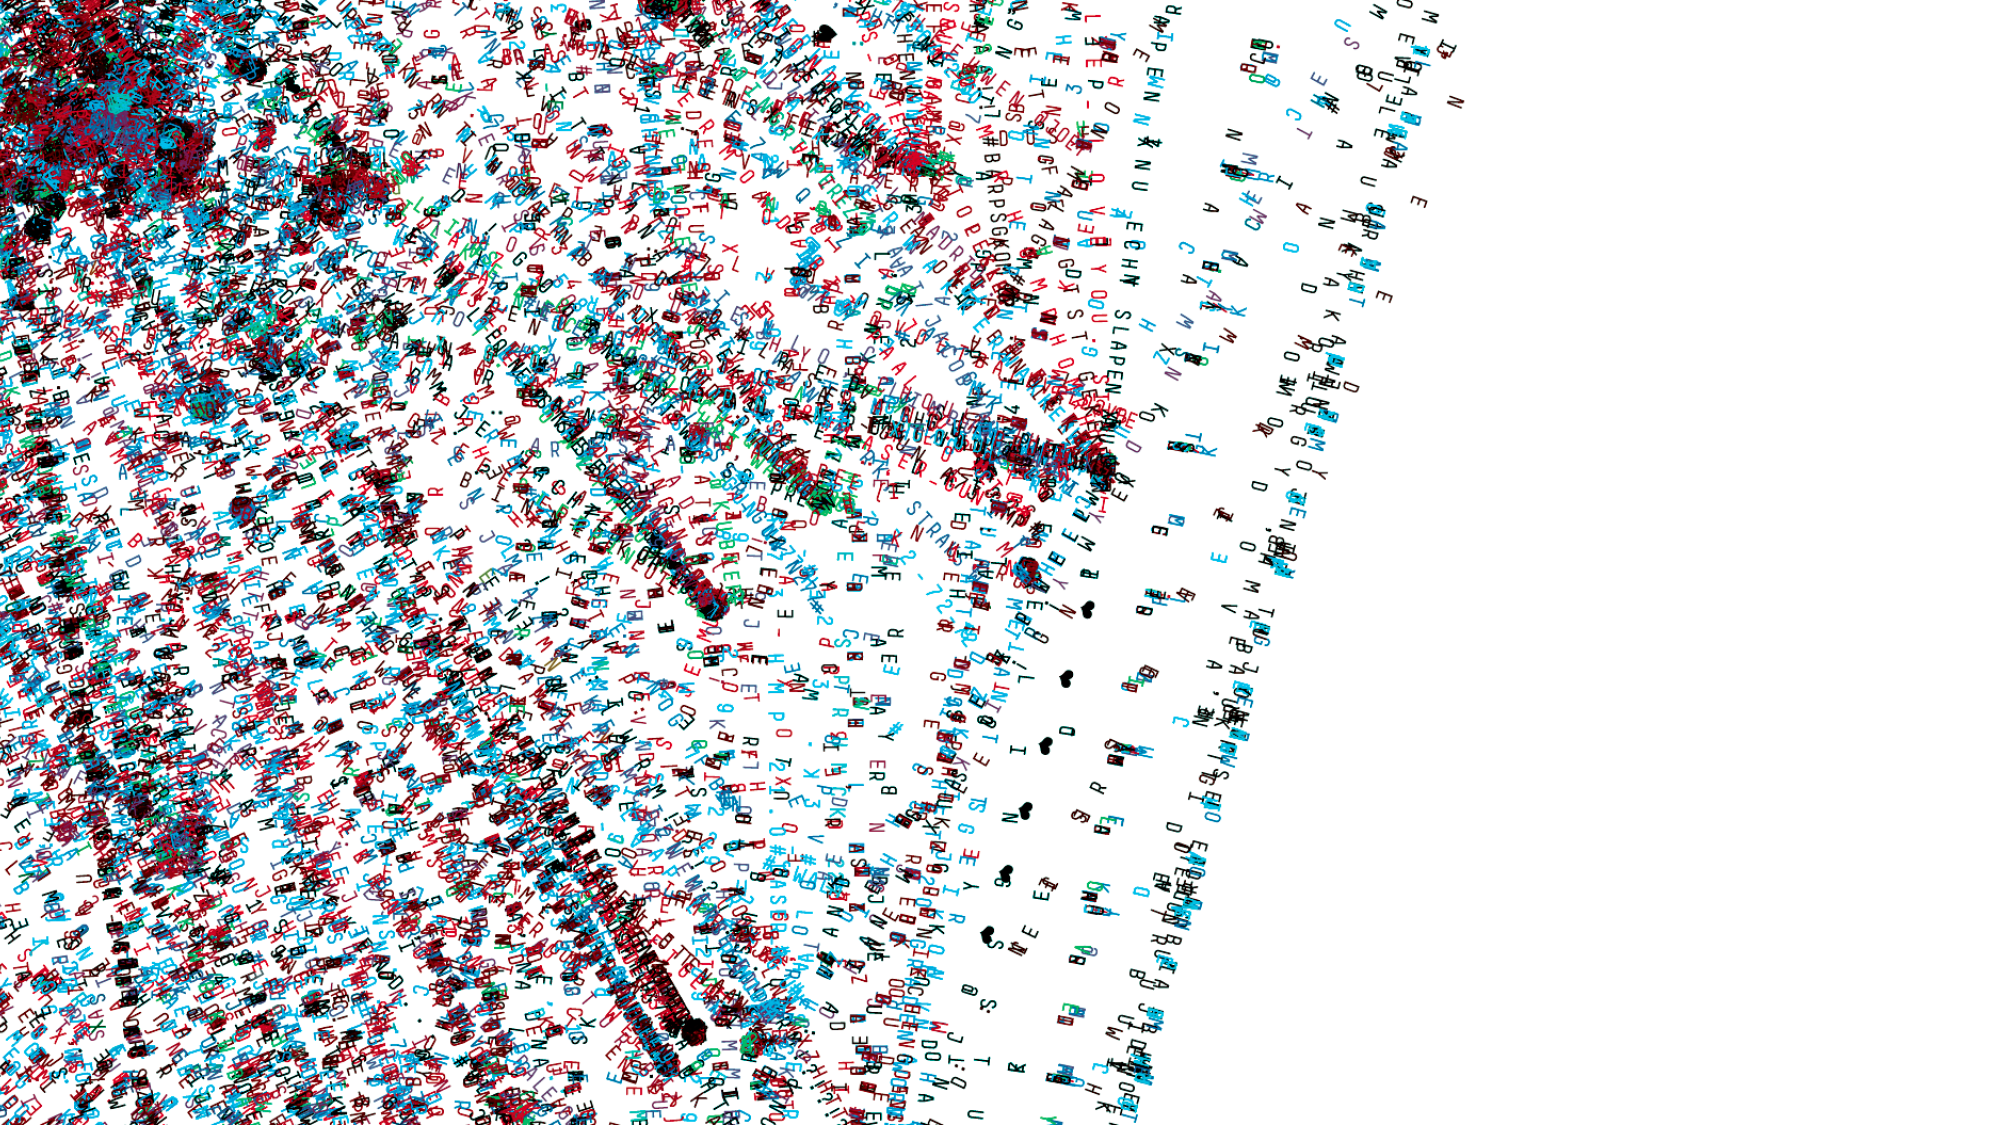
GEOGRAPHIC DATAVIZ RESEARCH
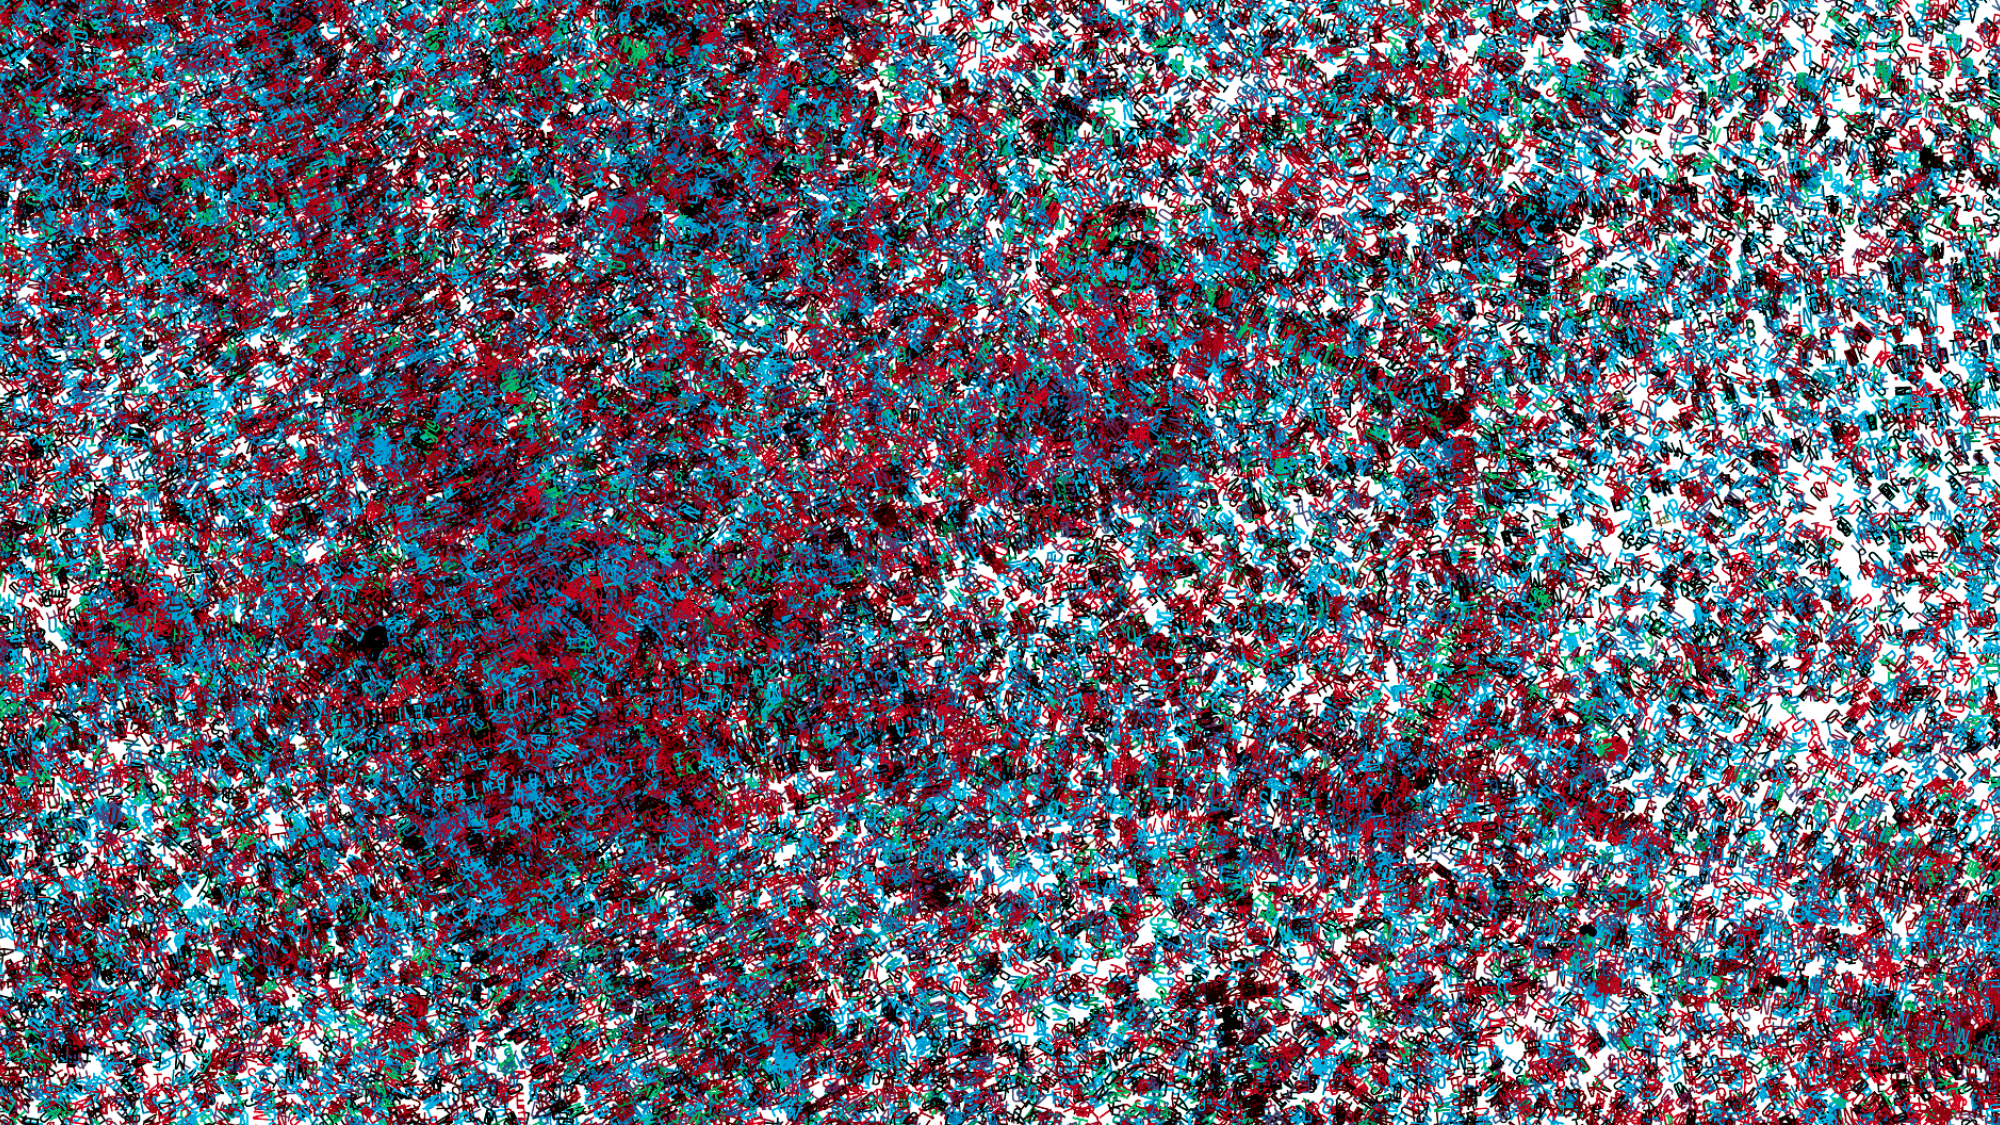
This visualization uses technologies developed during a broader project I was working on during my thesis, that explored the use of geotagged data from social networks. During this phase we tested many different ways to analyze and visualize such information, including sentiment and emotion analysis, like in the images below.